Fig. 11
Download original image
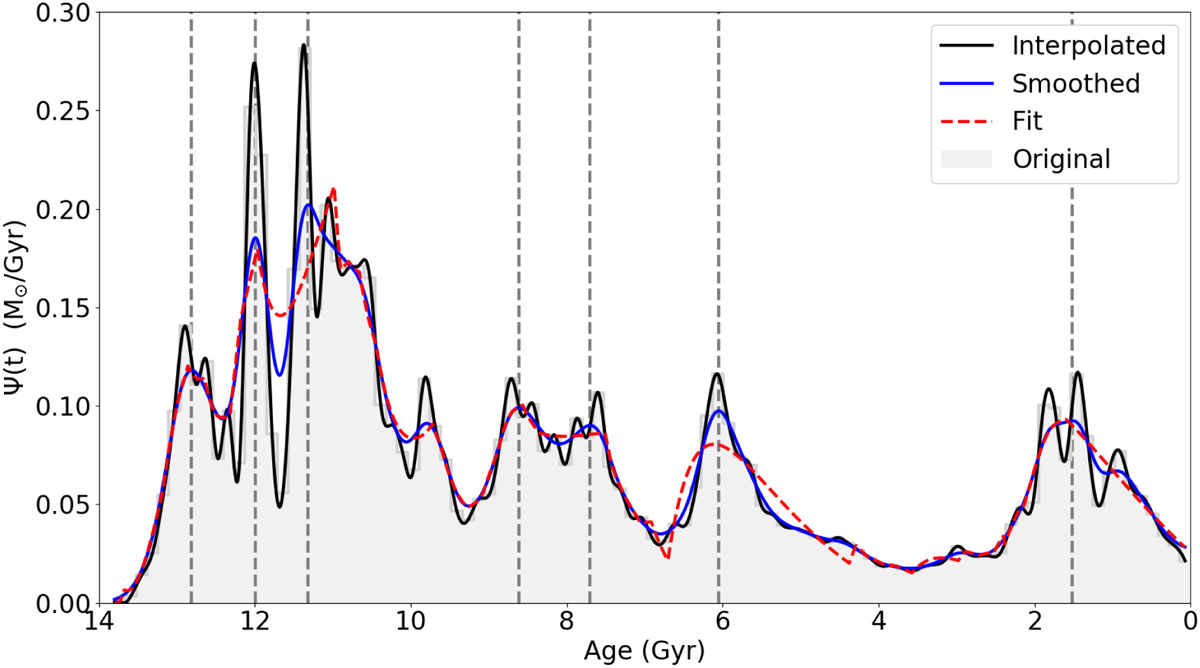
SFR of the GALACTICA simulated galaxy explored in Park et al. (2021) normalised to a total mass of 1 M⊙. The grey histogram represents the reported SFR, while the solid blue curve corresponds to the smoothed version of the interpolated curve (solid black line). The fit of the smoothed curve is represented by the dashed red line. The positions of the maxima, tmax, used in the determination of tk (see the text) are indicated by the vertical dashed lines.
Current usage metrics show cumulative count of Article Views (full-text article views including HTML views, PDF and ePub downloads, according to the available data) and Abstracts Views on Vision4Press platform.
Data correspond to usage on the plateform after 2015. The current usage metrics is available 48-96 hours after online publication and is updated daily on week days.
Initial download of the metrics may take a while.