Open Access
Fig. 4.
Download original image
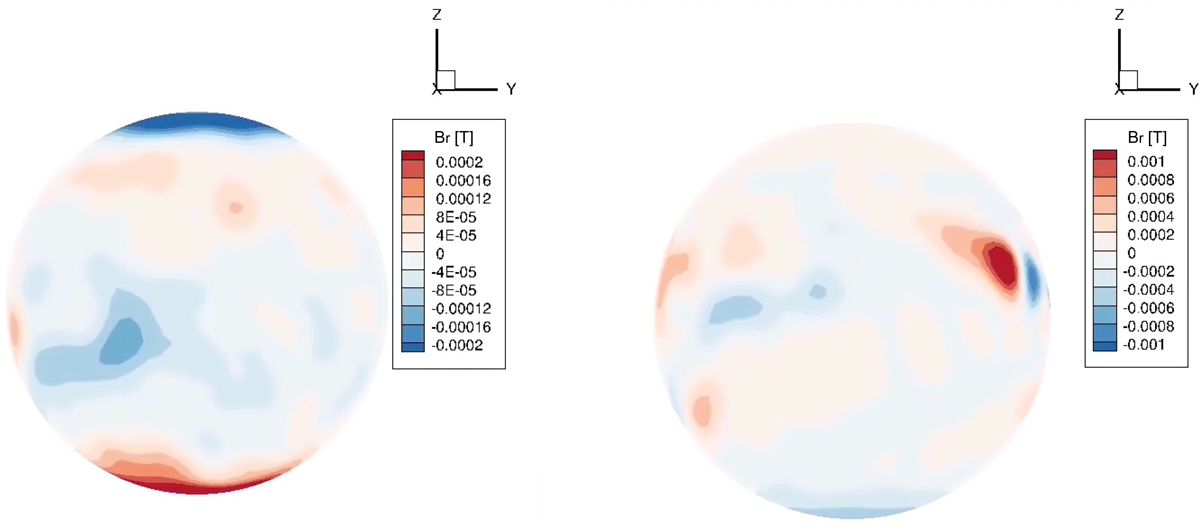
Boundary magnetic maps at the basic orientation (0 degree longitude) of the two cases simulated, August 1, 2008 (solar minimum) on the left and March 9, 2016 (solar maximum) on the right, using the prescription according to the bottom maps shown in Fig. 3.
Current usage metrics show cumulative count of Article Views (full-text article views including HTML views, PDF and ePub downloads, according to the available data) and Abstracts Views on Vision4Press platform.
Data correspond to usage on the plateform after 2015. The current usage metrics is available 48-96 hours after online publication and is updated daily on week days.
Initial download of the metrics may take a while.