Fig. 5.
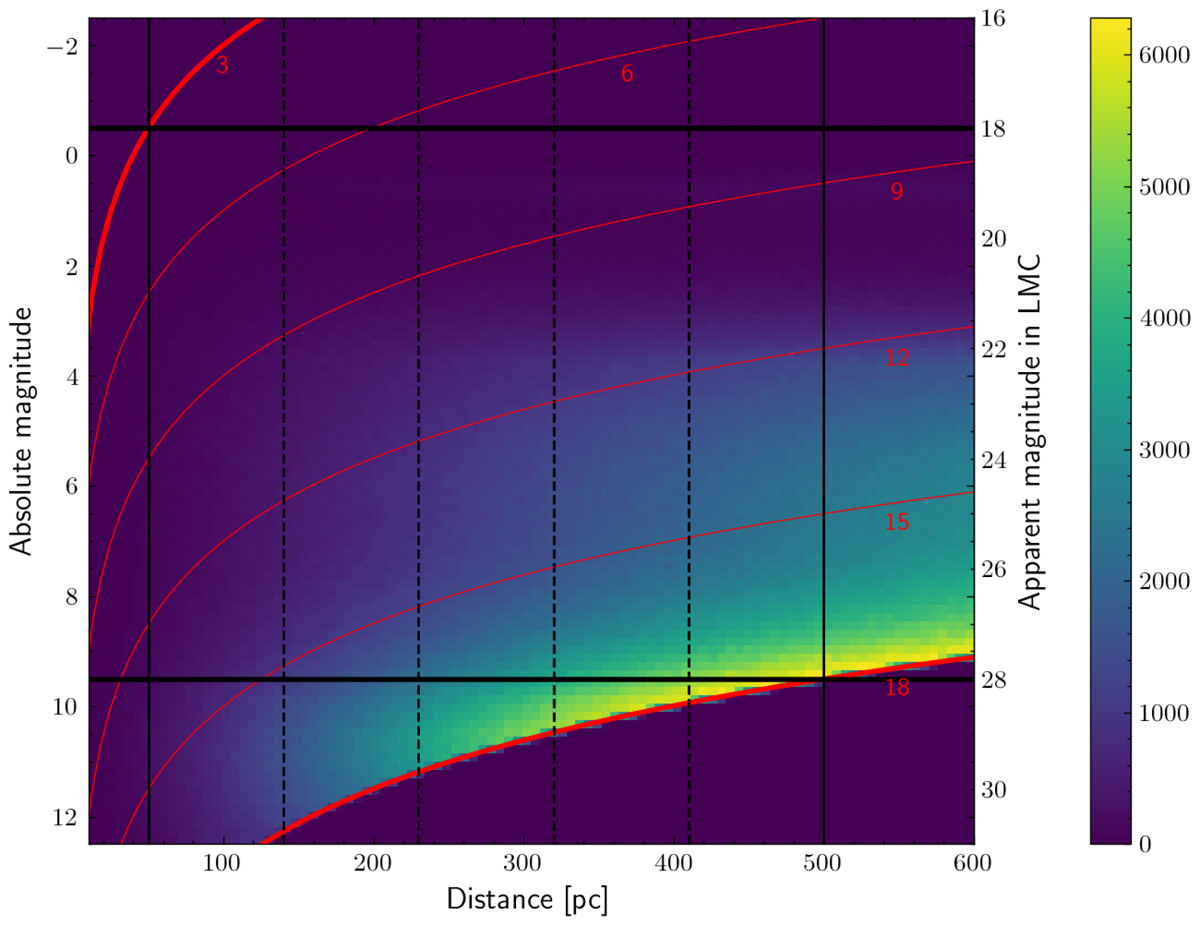
Download original image
Distribution of the number of stars in Gaia EDR3 as a function of their distance and absolute magnitude (left scale). The right scale gives the apparent magnitude that these stars would have in the LMC. The Gaia catalog is complete between the thick red curves. The red lines are the iso-apparent-magnitude lines in Gaia in the (distance, absolute magnitude) plane. We restricted the study to stars within the absolute magnitude range delimited by the thick horizontal black lines (−0.5 < G < 9.5), which ensures the homogeneity of the stellar type over the volume we considered; the vertical solid lines correspond to the distance limits of our sample. The vertical dashed black lines delineate the distance domains of the shells we consider in our analysis (between 50 and 500 pc).
Current usage metrics show cumulative count of Article Views (full-text article views including HTML views, PDF and ePub downloads, according to the available data) and Abstracts Views on Vision4Press platform.
Data correspond to usage on the plateform after 2015. The current usage metrics is available 48-96 hours after online publication and is updated daily on week days.
Initial download of the metrics may take a while.