Fig. 3.

Download original image
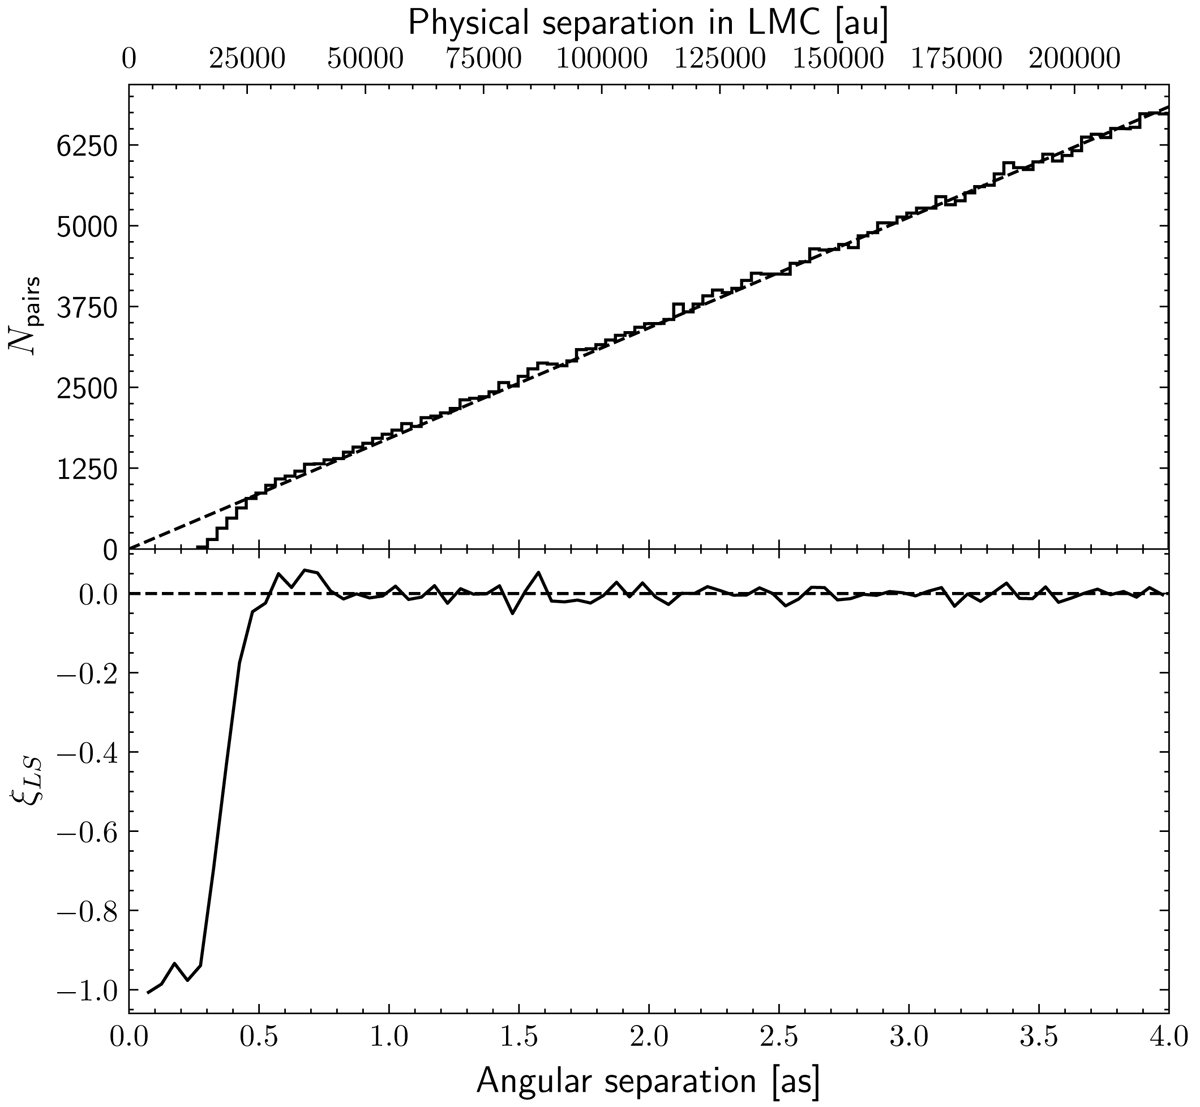
Number of pairs and two-point correlation function of stars in a HST-crowded LMC field image. Top panel: number of pairs of stars per 1.2″ interval as a function of their angular separation. The dotted line gives the predicted distribution of angular separations in the case of a spatially uniform distribution of stars with the same average star density. Bottom panel: measured two-point angular correlation function of the detected stars. The lower scale is the angular separation δ and the upper scale gives the corresponding transverse separation in the LMC.
Current usage metrics show cumulative count of Article Views (full-text article views including HTML views, PDF and ePub downloads, according to the available data) and Abstracts Views on Vision4Press platform.
Data correspond to usage on the plateform after 2015. The current usage metrics is available 48-96 hours after online publication and is updated daily on week days.
Initial download of the metrics may take a while.


