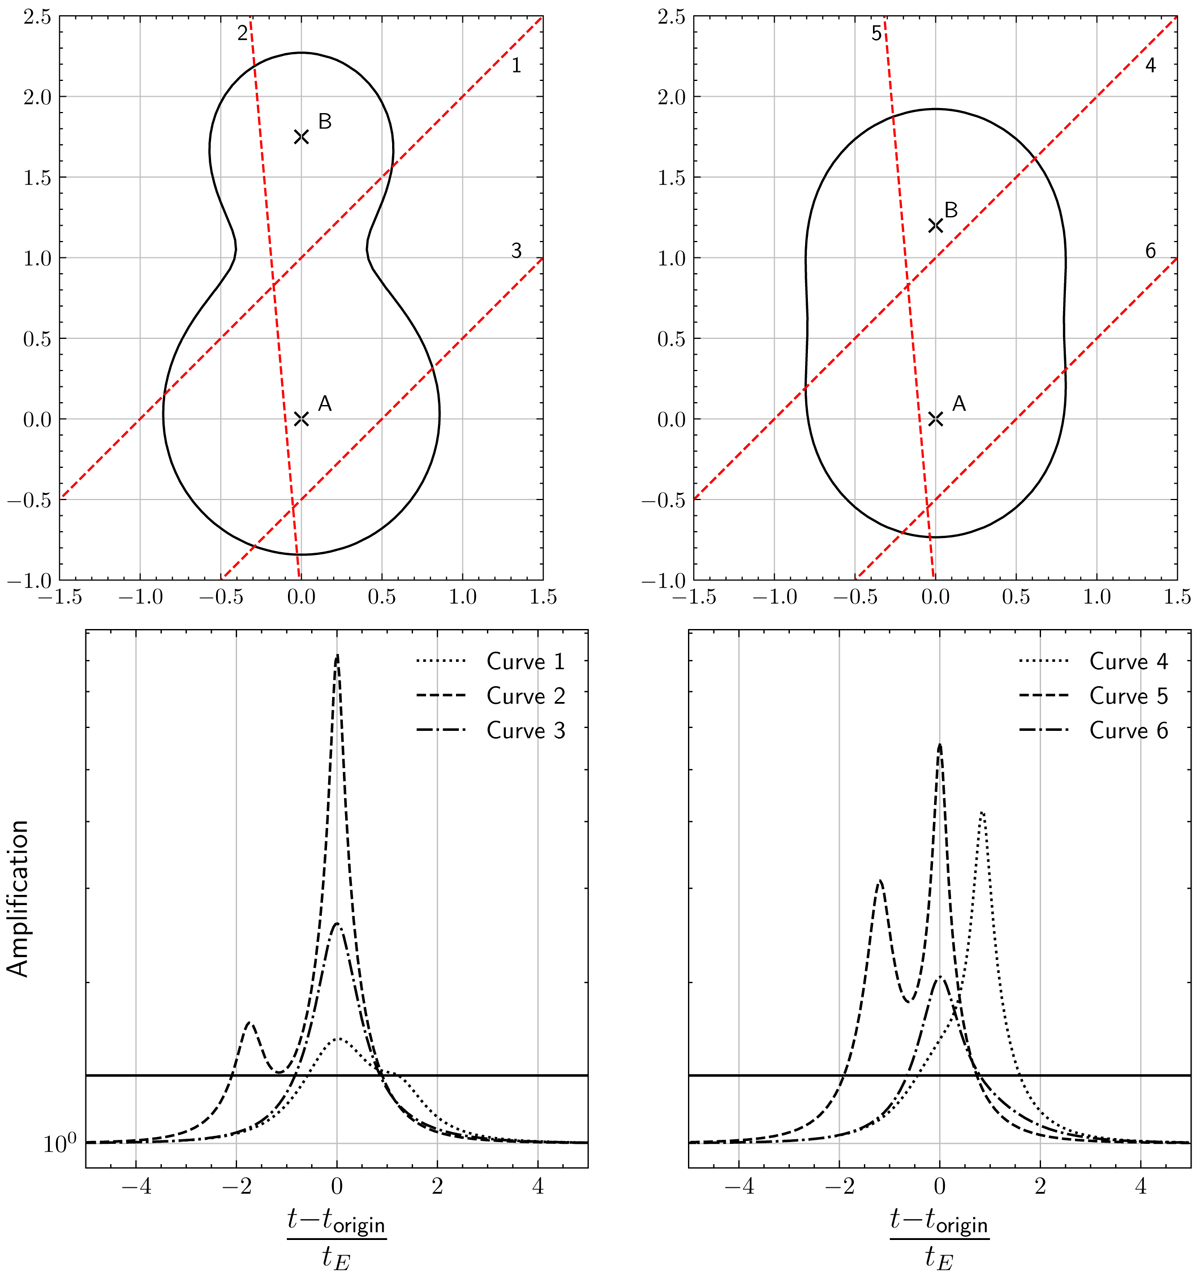
Fig. 2.
Download original image
Lens paths and associated light-curves. Top panels: three different trajectories of a deflector (red dashed) in front of the two stars A and B blended into a single cataloged source; on the left, stars A and B share 80% and 20% of the total luminous flux, respectively, and on the right both stars have the same luminosity. The black outline corresponds to the positions where the deflector must be for the source system to undergo a total magnification of 1.34. The coordinates are in units of Einstein radius, which is the same for both stars (located at the same distance). Bottom panels: magnification curves of the cataloged source system corresponding to the trajectories above, which travelled from left to right. The black line corresponds to a magnification of 1.34. We note that torigin is the time when the deflector is closest to the star A (and thus does not always coincide with the time of maximum apparent amplification). Curves 3 and 6 are very close to microlensing curves with ordinary blending because the deflector passes far from star B.
Current usage metrics show cumulative count of Article Views (full-text article views including HTML views, PDF and ePub downloads, according to the available data) and Abstracts Views on Vision4Press platform.
Data correspond to usage on the plateform after 2015. The current usage metrics is available 48-96 hours after online publication and is updated daily on week days.
Initial download of the metrics may take a while.