Fig. 11.
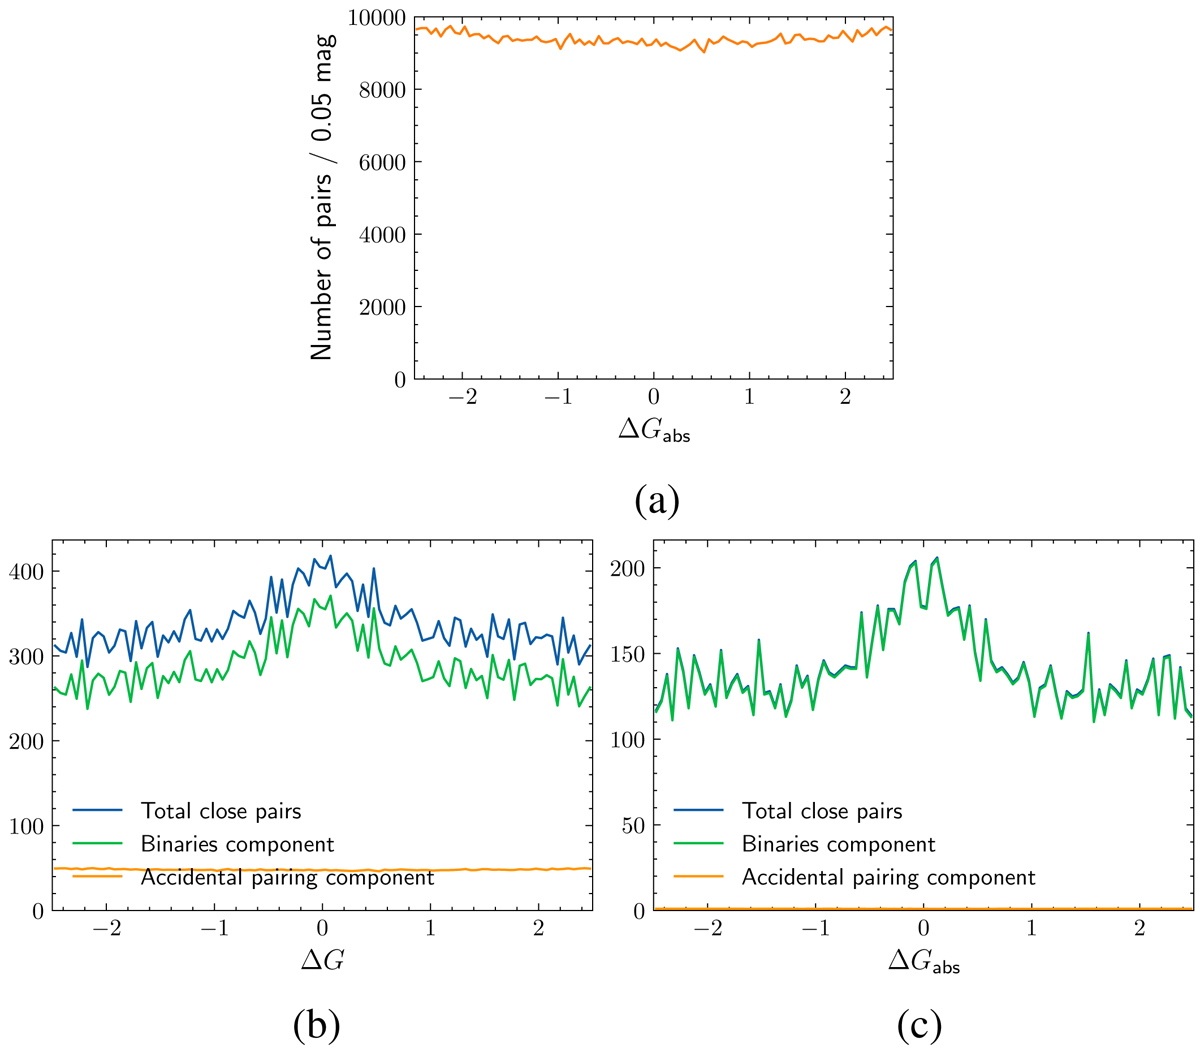
Download original image
Magnitude differences between components of pairs, for different separation ranges. (a) Magnitude differences for pairs separated by more than 30 000 au (only due to fortuitous alignments). (b) and (c) Same distributions for pairs separated by 1000 < at < 2500 au and at < 1000 au (blue), distributions for the fortuitous alignments (orange), normalized according to the sample size, and the difference between the two distributions (green; i.e., the distribution of the magnitude difference for binary systems only). These histograms are sampled in 0.05 mag steps with one entry per star. In panel c, the number of fortuitous alignments is negligible, and thus the orange distribution is almost zero and green and blue distributions are superimposed.
Current usage metrics show cumulative count of Article Views (full-text article views including HTML views, PDF and ePub downloads, according to the available data) and Abstracts Views on Vision4Press platform.
Data correspond to usage on the plateform after 2015. The current usage metrics is available 48-96 hours after online publication and is updated daily on week days.
Initial download of the metrics may take a while.