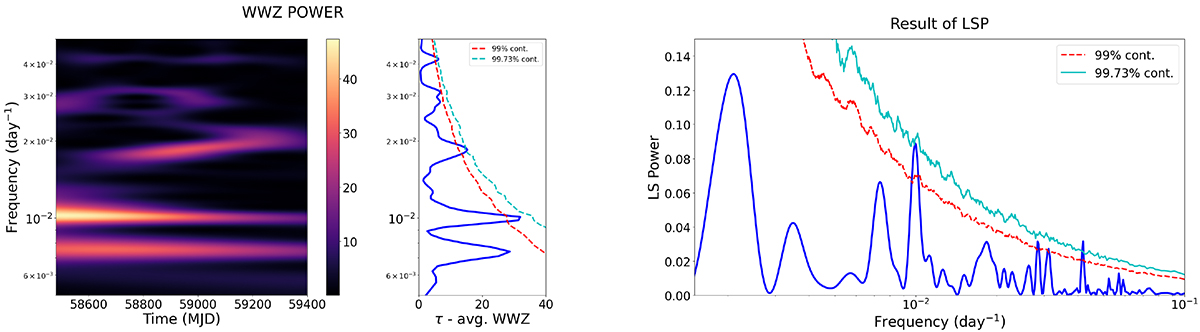
Fig. 2.
Download original image
Plausible detection of the QPO feature corresponding to the LC shown in the bottom panel in Fig. 1. Right panel: LSP with the statistical significance of the LSP peak, along with the average WWZ map. The observed 0.01-day−1 peak is ∼3σ significant. The average WWZ map shows a distinct peak at this frequency as well, strongly suggesting the presence of a QPO feature. Left panel: WWZ map and the time-averaged power. A distinct concentration of power within a narrow frequency band of around 100 days (0.01 days−1) is observed. A 99.0% and a 99.73% significance are estimated for the LSP and WWZ results, respectively, which are shown in red and cyan.
Current usage metrics show cumulative count of Article Views (full-text article views including HTML views, PDF and ePub downloads, according to the available data) and Abstracts Views on Vision4Press platform.
Data correspond to usage on the plateform after 2015. The current usage metrics is available 48-96 hours after online publication and is updated daily on week days.
Initial download of the metrics may take a while.