Fig. 9
Download original image
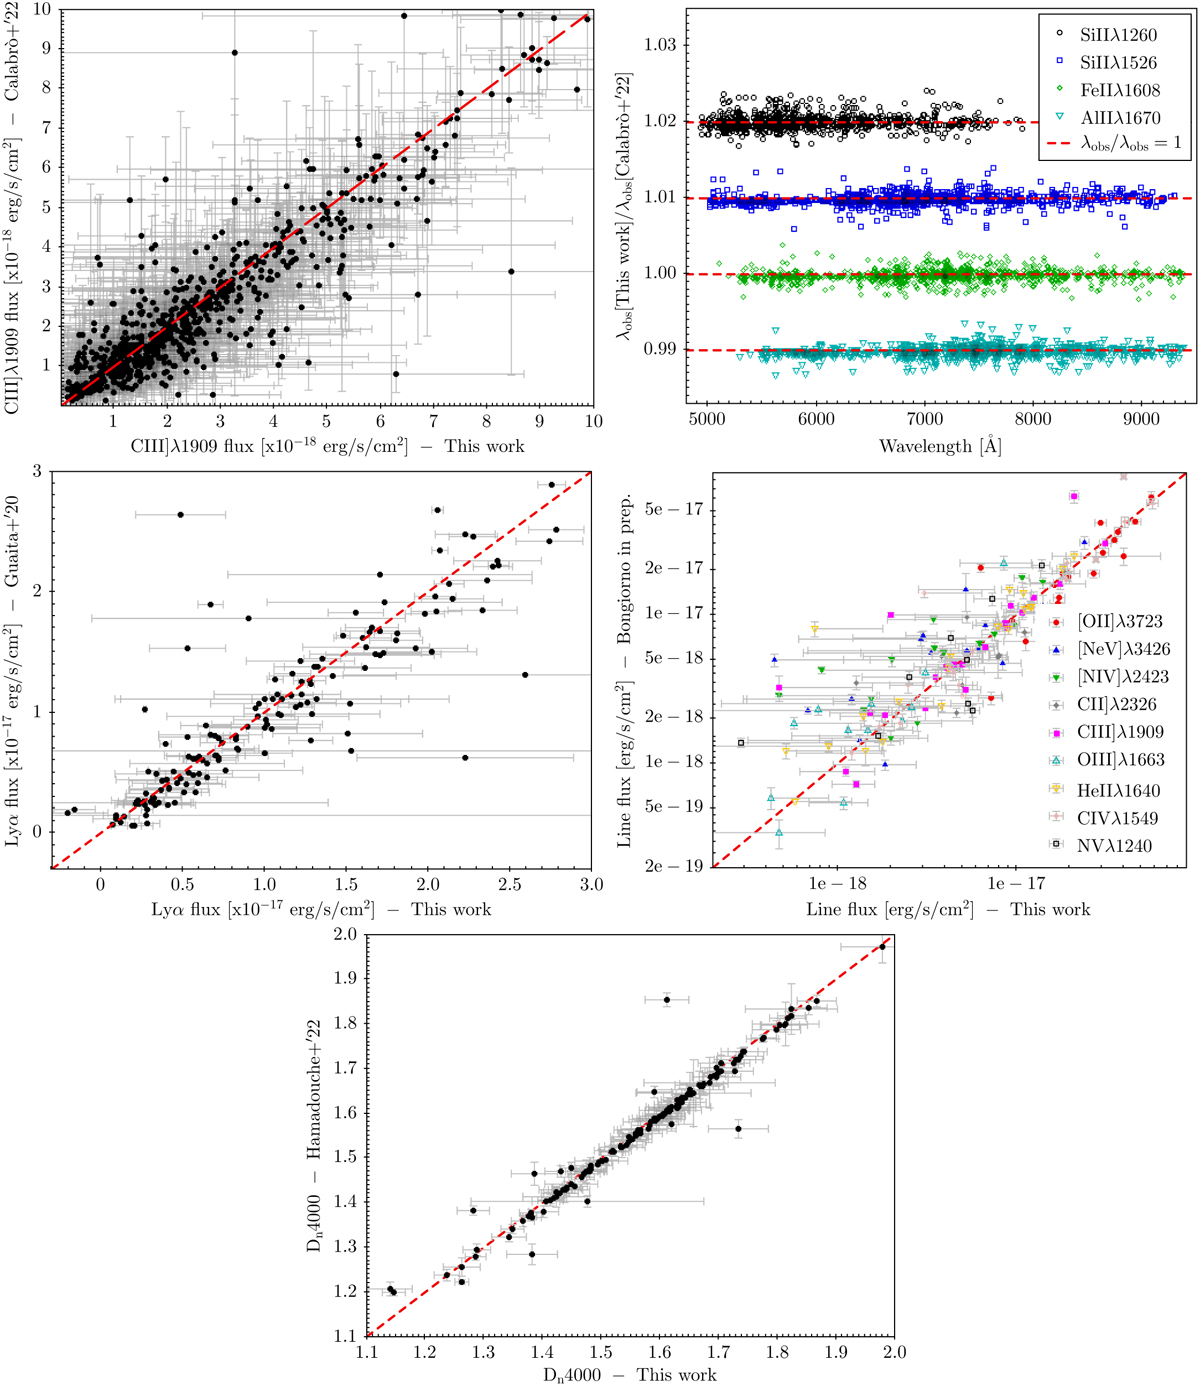
Comparison between trie measurements presented in this work and previously published VANDELS results. In all plots we also show the one-to-one relation (dashed red line). Top left: CIII]λ1909Å flux from Calabrò et al. (2022b; Gaussian fit). Top right: interstellar medium absorption line centroids from Calabrò et al. (2022b; Gaussian fit; the points for the different ions have been shifted by 0.01 for visualisation purposes). Middle left: Lyα flux from Guaita et al. (2020; Gaussian fit; no error was available for these measurements). Middle right: AGN emission line flux trom Bongiorno et al. (in prep.; Gaussian tit). Bottom: Dn4000 from Hamadouche et al. (2022; direct integration).
Current usage metrics show cumulative count of Article Views (full-text article views including HTML views, PDF and ePub downloads, according to the available data) and Abstracts Views on Vision4Press platform.
Data correspond to usage on the plateform after 2015. The current usage metrics is available 48-96 hours after online publication and is updated daily on week days.
Initial download of the metrics may take a while.