Fig. 7
Download original image
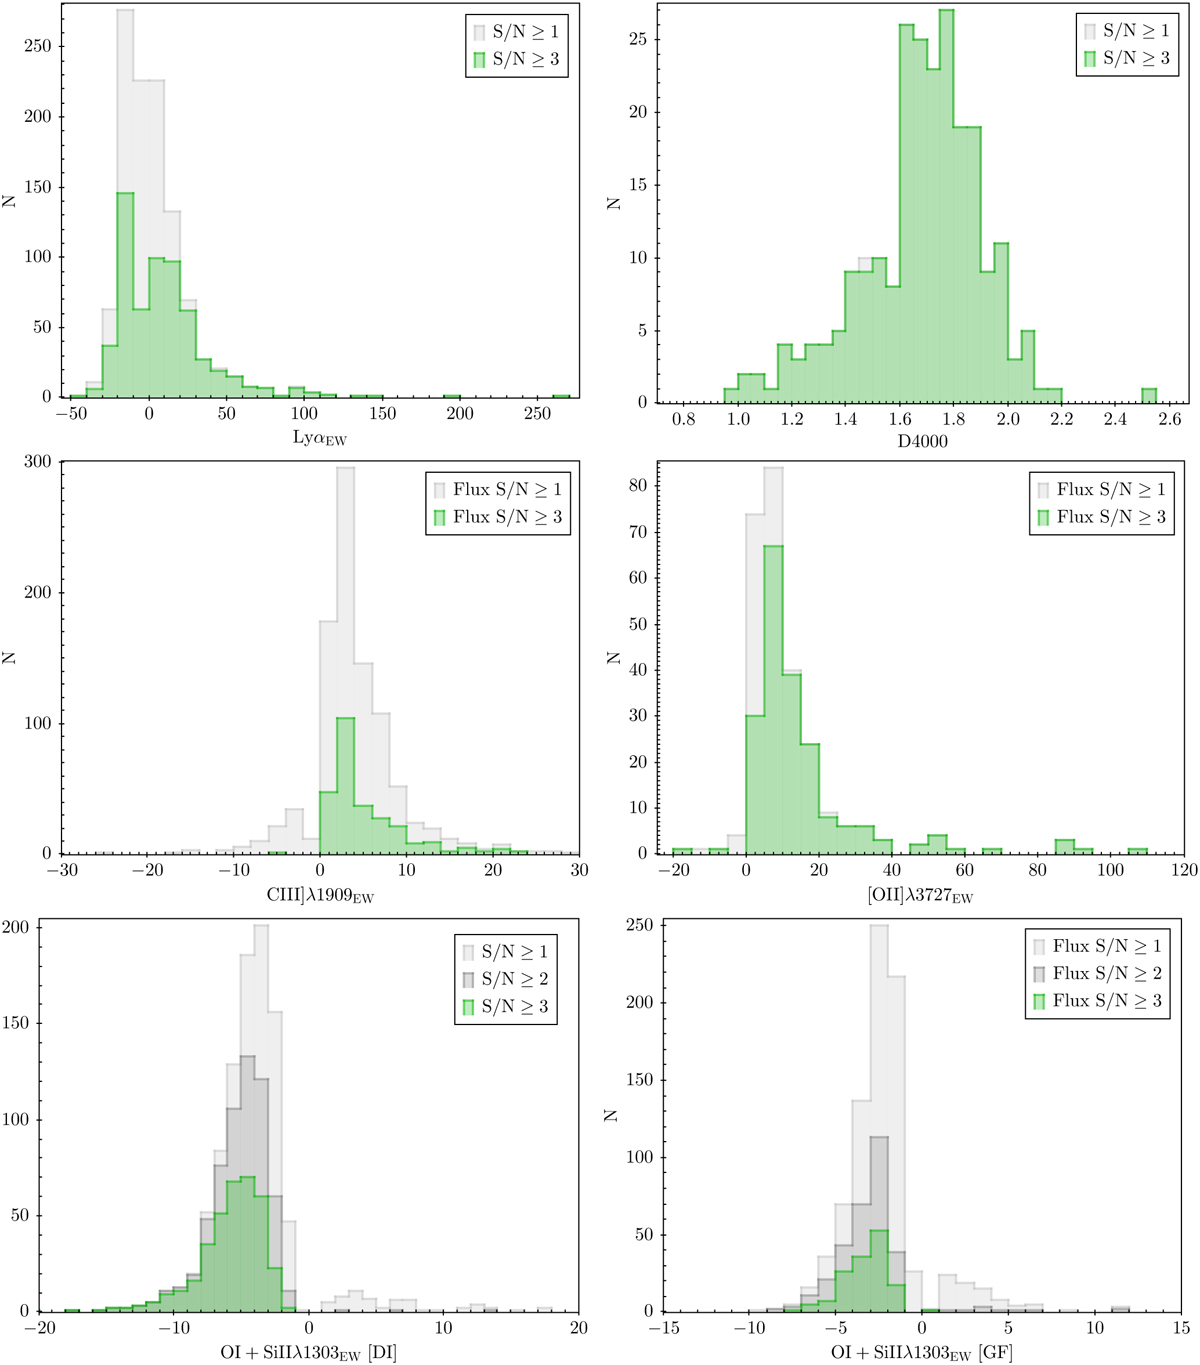
Distributions of the D4000 break and the EW of some notable lines. In each panel we show the distributions at S/N ≥ 1 (light grey) and S/N ≥ 3 (green). For the lines from the 'Gaussian fit' catalogues, the cut is in S/N flux. Top left: Lya EW (direct integration). Top right: D4000 (direct integration). Middle left: CIII]λ909 Å EW (Gaussian fit). Middle right: [OII]λ3727 Å EW (Gaussian fit). Bottom left: OI+SiIIλ303 Å EW (direct integration). Bottom right: OI+SiIIλ1303 A EW (Gaussian fit). In the last two panels, we also show the distribution at S/N > 2 (dark grey).
Current usage metrics show cumulative count of Article Views (full-text article views including HTML views, PDF and ePub downloads, according to the available data) and Abstracts Views on Vision4Press platform.
Data correspond to usage on the plateform after 2015. The current usage metrics is available 48-96 hours after online publication and is updated daily on week days.
Initial download of the metrics may take a while.