Fig. 4
Download original image
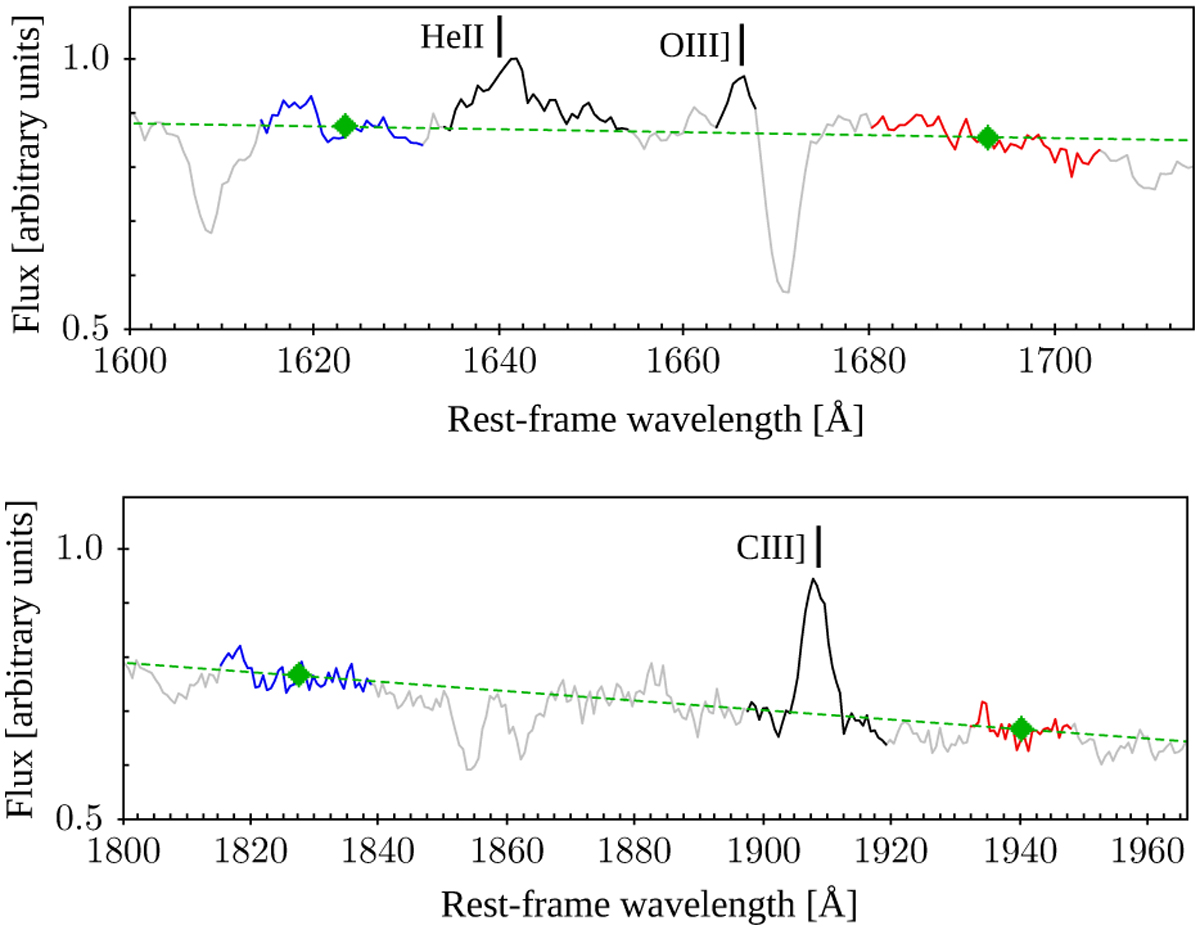
Median composite spectrum of VANDELS sources (grey). The upper and lower panels show zoomed-in regions around the HeIIλ1640+OIII]λ1666 and CIII]λ1909 lines, respectively. The central bandpasses, as indicated in Table 3, are marked in black, while the two local continuum windows are marked in blue and red. The green points and dashed lines indicate the mean flux in the continuum bandpasses and the linear pseudo-continuum.
Current usage metrics show cumulative count of Article Views (full-text article views including HTML views, PDF and ePub downloads, according to the available data) and Abstracts Views on Vision4Press platform.
Data correspond to usage on the plateform after 2015. The current usage metrics is available 48-96 hours after online publication and is updated daily on week days.
Initial download of the metrics may take a while.