Fig. 3
Download original image
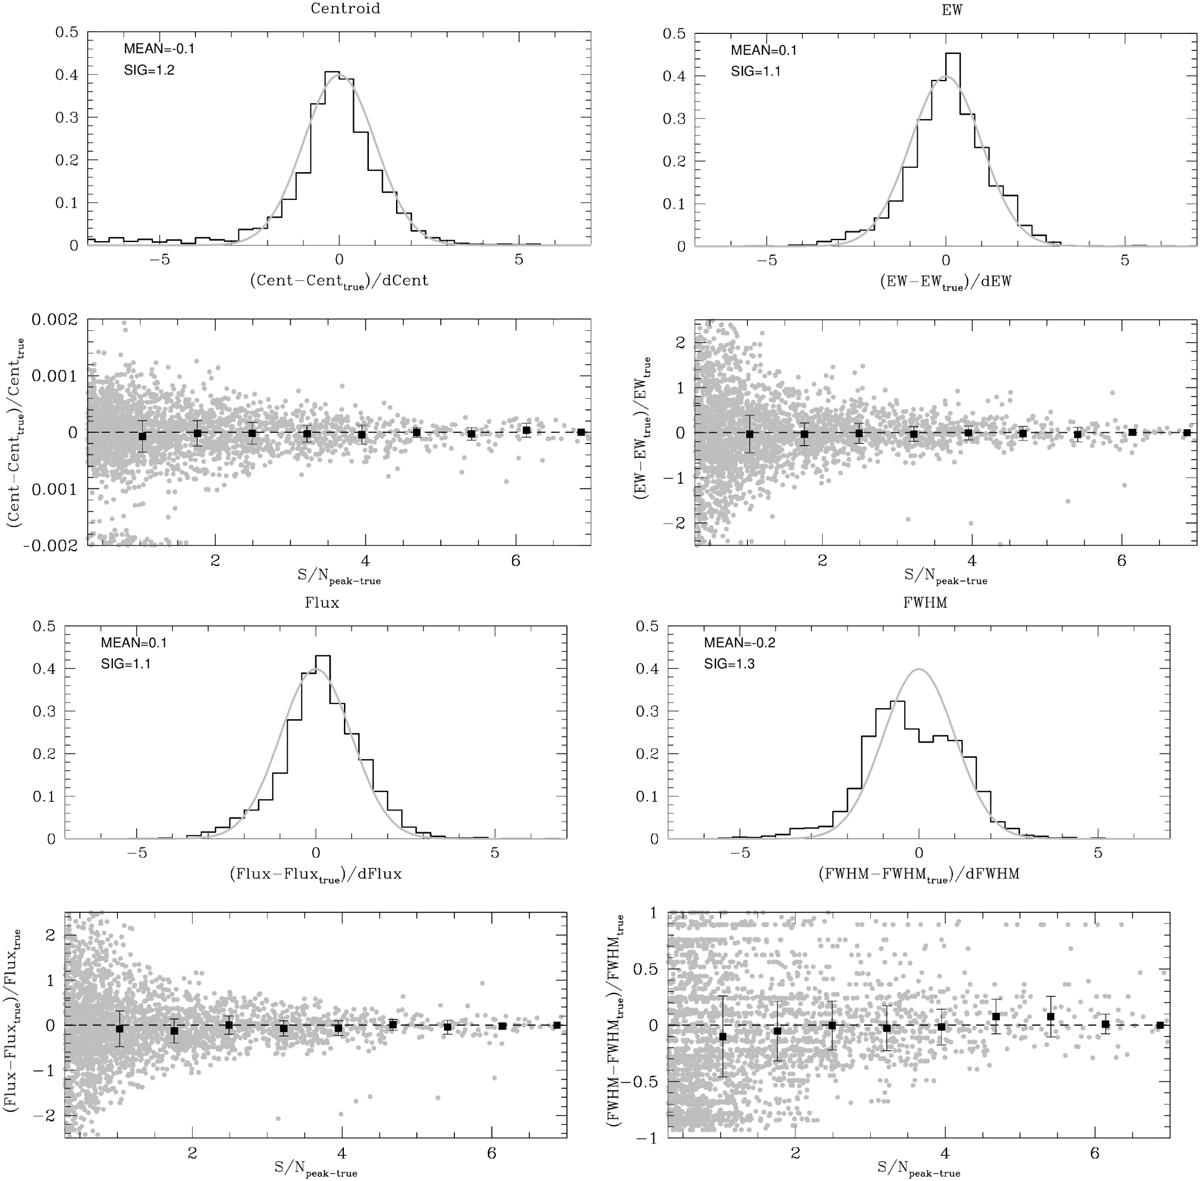
Comparison between slinefit results and input values for the sample of 270 mock spectra. In the top panels, we plotted the pull distributions. As a reference, we marked with a grey curve a Gaussian with a null mean and unity sigma. In the bottom panels, we plotted the relative change of the measured spectral quantities, with respect to their input values, as a function of the peak S/N of the lines. Black squares represent the median values of the relative change in bins of the S/N; error bars are the semi-interquartile range (SIQR). The line parameters are, starting clockwise from the top left figure: line centroid, EW, FWHM, and flux.
Current usage metrics show cumulative count of Article Views (full-text article views including HTML views, PDF and ePub downloads, according to the available data) and Abstracts Views on Vision4Press platform.
Data correspond to usage on the plateform after 2015. The current usage metrics is available 48-96 hours after online publication and is updated daily on week days.
Initial download of the metrics may take a while.