Open Access
Fig. E.2.
Download original image
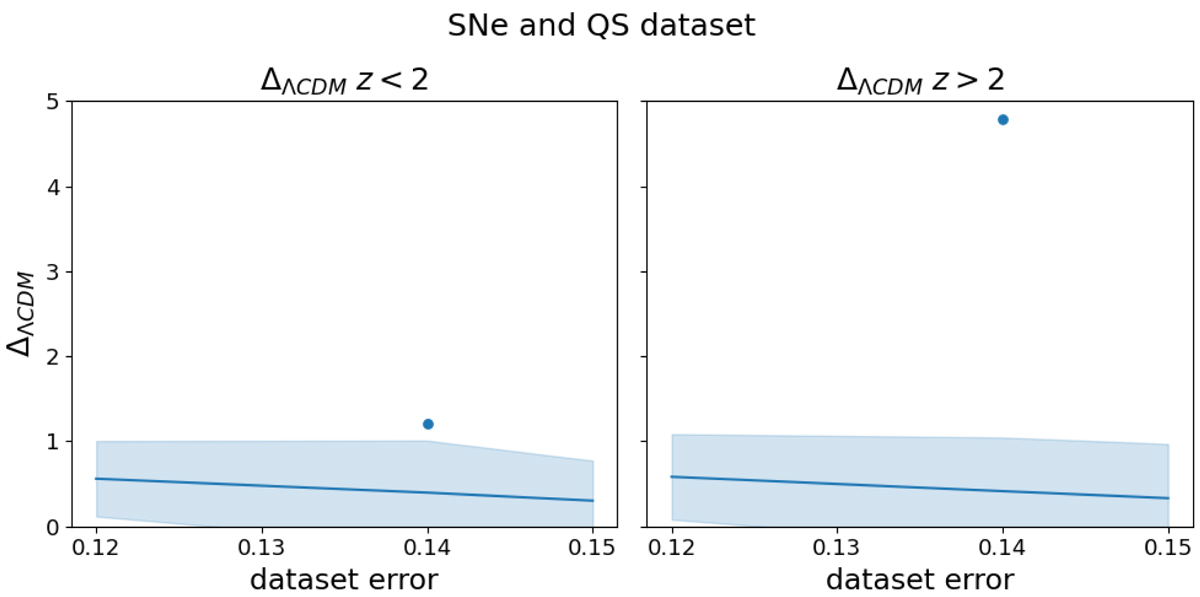
ΔΛCDM vs. the imposed error for the combined supernova + quasar sample at redshifts z < 2 (left panel) and z > 2 (right panel). The dots refer to the experimental data, while the solid lines and the shadowed regions stand for the corresponding theoretical benchmarks, obtained as described in the text.
Current usage metrics show cumulative count of Article Views (full-text article views including HTML views, PDF and ePub downloads, according to the available data) and Abstracts Views on Vision4Press platform.
Data correspond to usage on the plateform after 2015. The current usage metrics is available 48-96 hours after online publication and is updated daily on week days.
Initial download of the metrics may take a while.