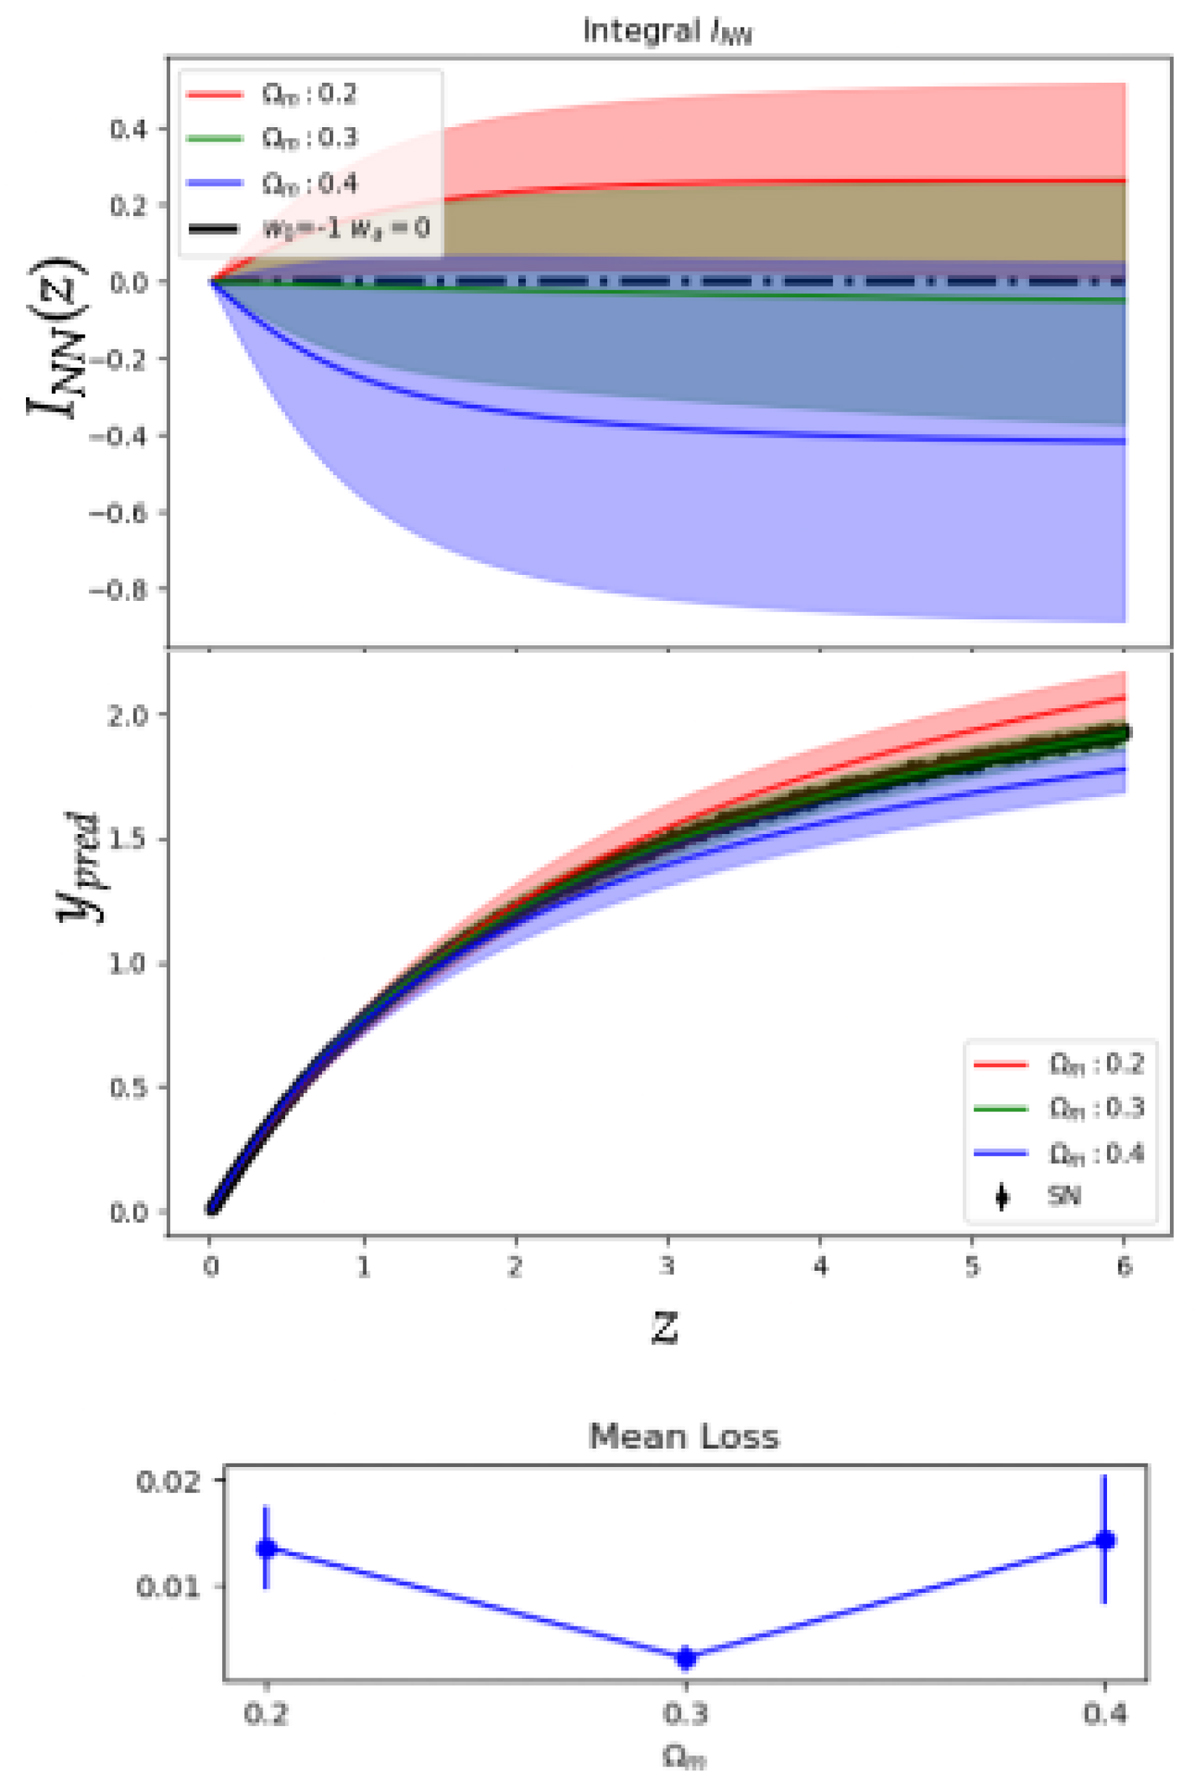
Fig. D.1.
Download original image
Simulations with a "perfect" sample (data set A): results of the NN analysis of a simulated sample of 4,000 objects with a log-flat redshift distribution and a negligible dispersion with respect to a flat ΛCDM model with ΩM = 0.3. Top panel: Estimated values of I(z) for different values of ΩM (Eq. 3; the "correct" value for the simulated data is I(z)≡0). Central panel: Hubble diagram with the reconstructed best-fit function obtained from the NN analysis. Bottom panel: Loss values for different values of ΩM. The minimum is at ΩM = 0.3, i.e., the "true" value. The corresponding I(z) is consistent with zero at all redshifts. These results demonstrate that the NN analysis is able to recover the correct model and the "true"value of ΩM.
Current usage metrics show cumulative count of Article Views (full-text article views including HTML views, PDF and ePub downloads, according to the available data) and Abstracts Views on Vision4Press platform.
Data correspond to usage on the plateform after 2015. The current usage metrics is available 48-96 hours after online publication and is updated daily on week days.
Initial download of the metrics may take a while.