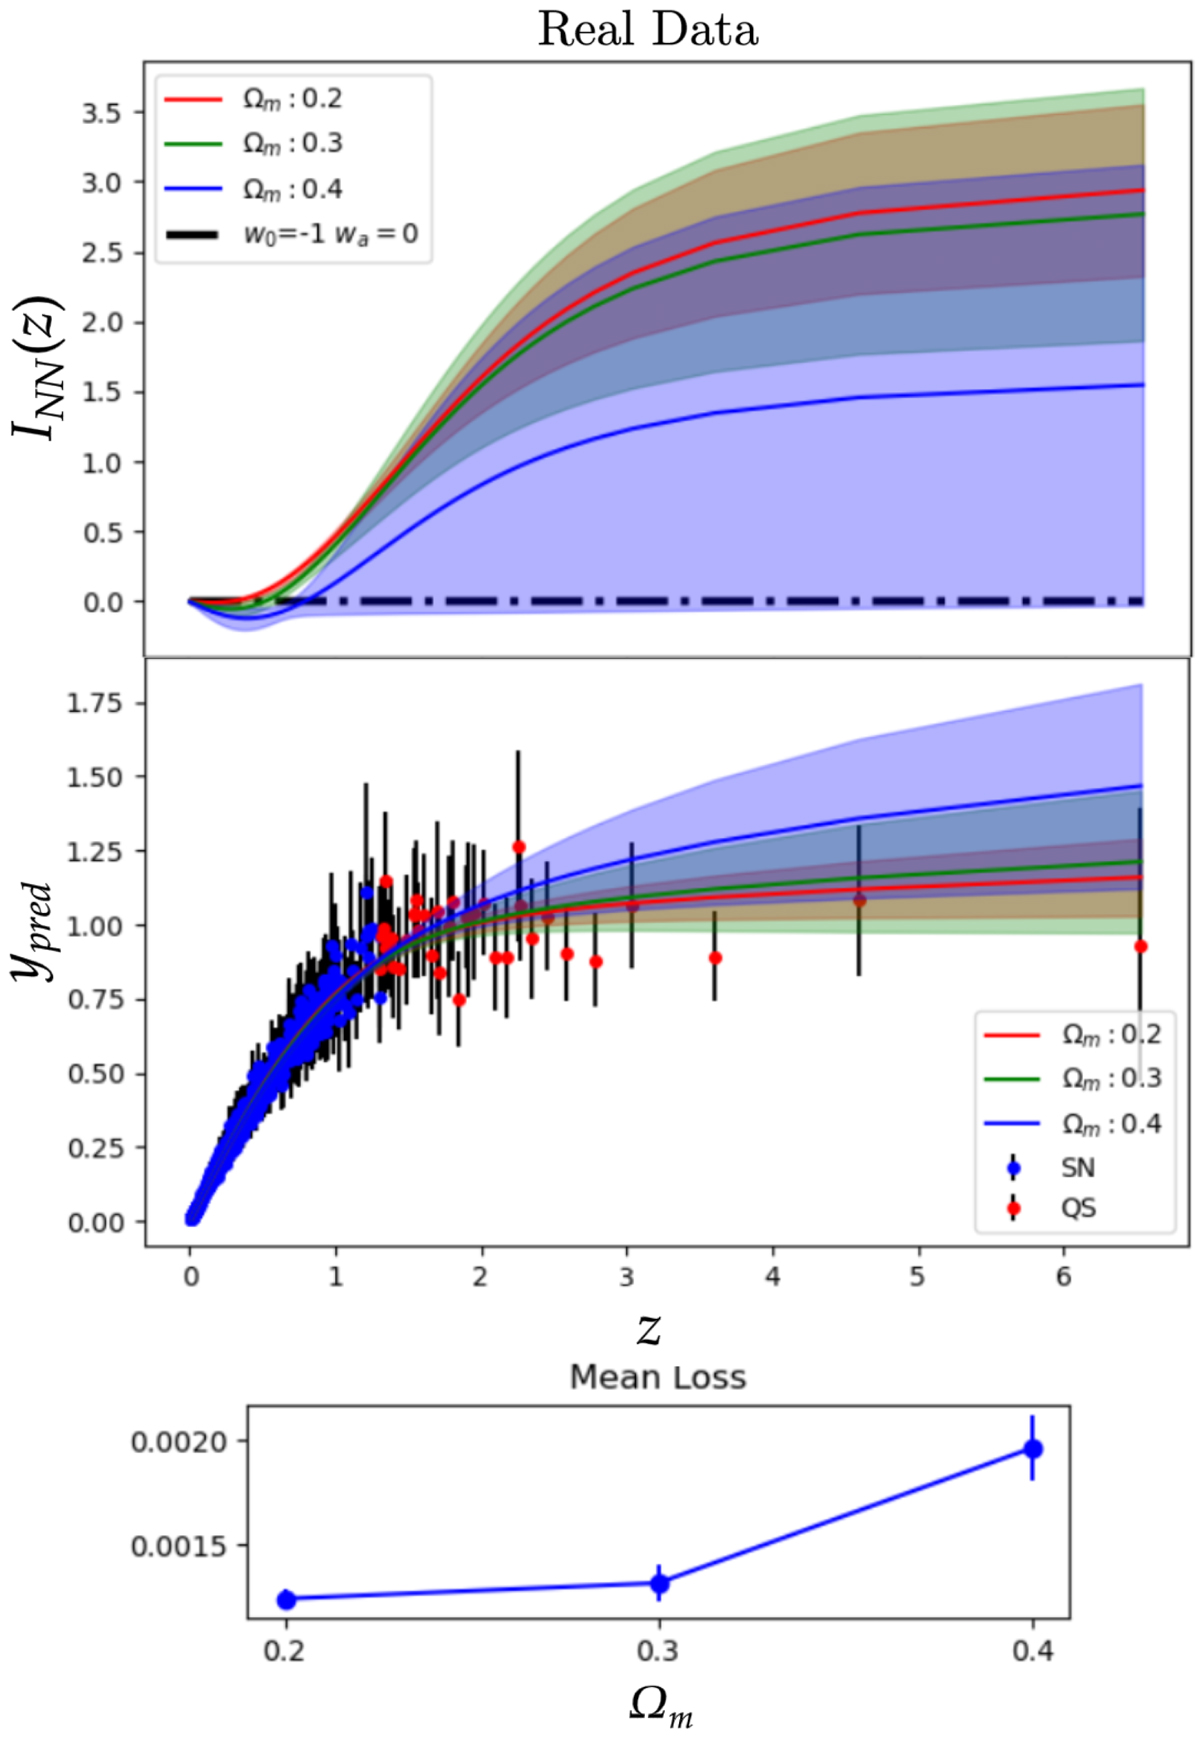
Fig. 2.
Download original image
Results of the NN analysis of the Hubble diagram of supernovae (blue points in the middle panel) and quasars (red points). Top panel: estimated values of I(z) for different values of ΩM. Central panel: Hubble diagram with the reconstructed best-fit function obtained from the NN analysis. Bottom panel: Loss values for different values of ΩM. Notice that the solution visually closer (accounting for statistical errors) to the reference ΛCDM profile yields a significantly larger loss value and, as such, should be disregarded. The Loss is indeed nearly flat for ΩM < 0.3.
Current usage metrics show cumulative count of Article Views (full-text article views including HTML views, PDF and ePub downloads, according to the available data) and Abstracts Views on Vision4Press platform.
Data correspond to usage on the plateform after 2015. The current usage metrics is available 48-96 hours after online publication and is updated daily on week days.
Initial download of the metrics may take a while.