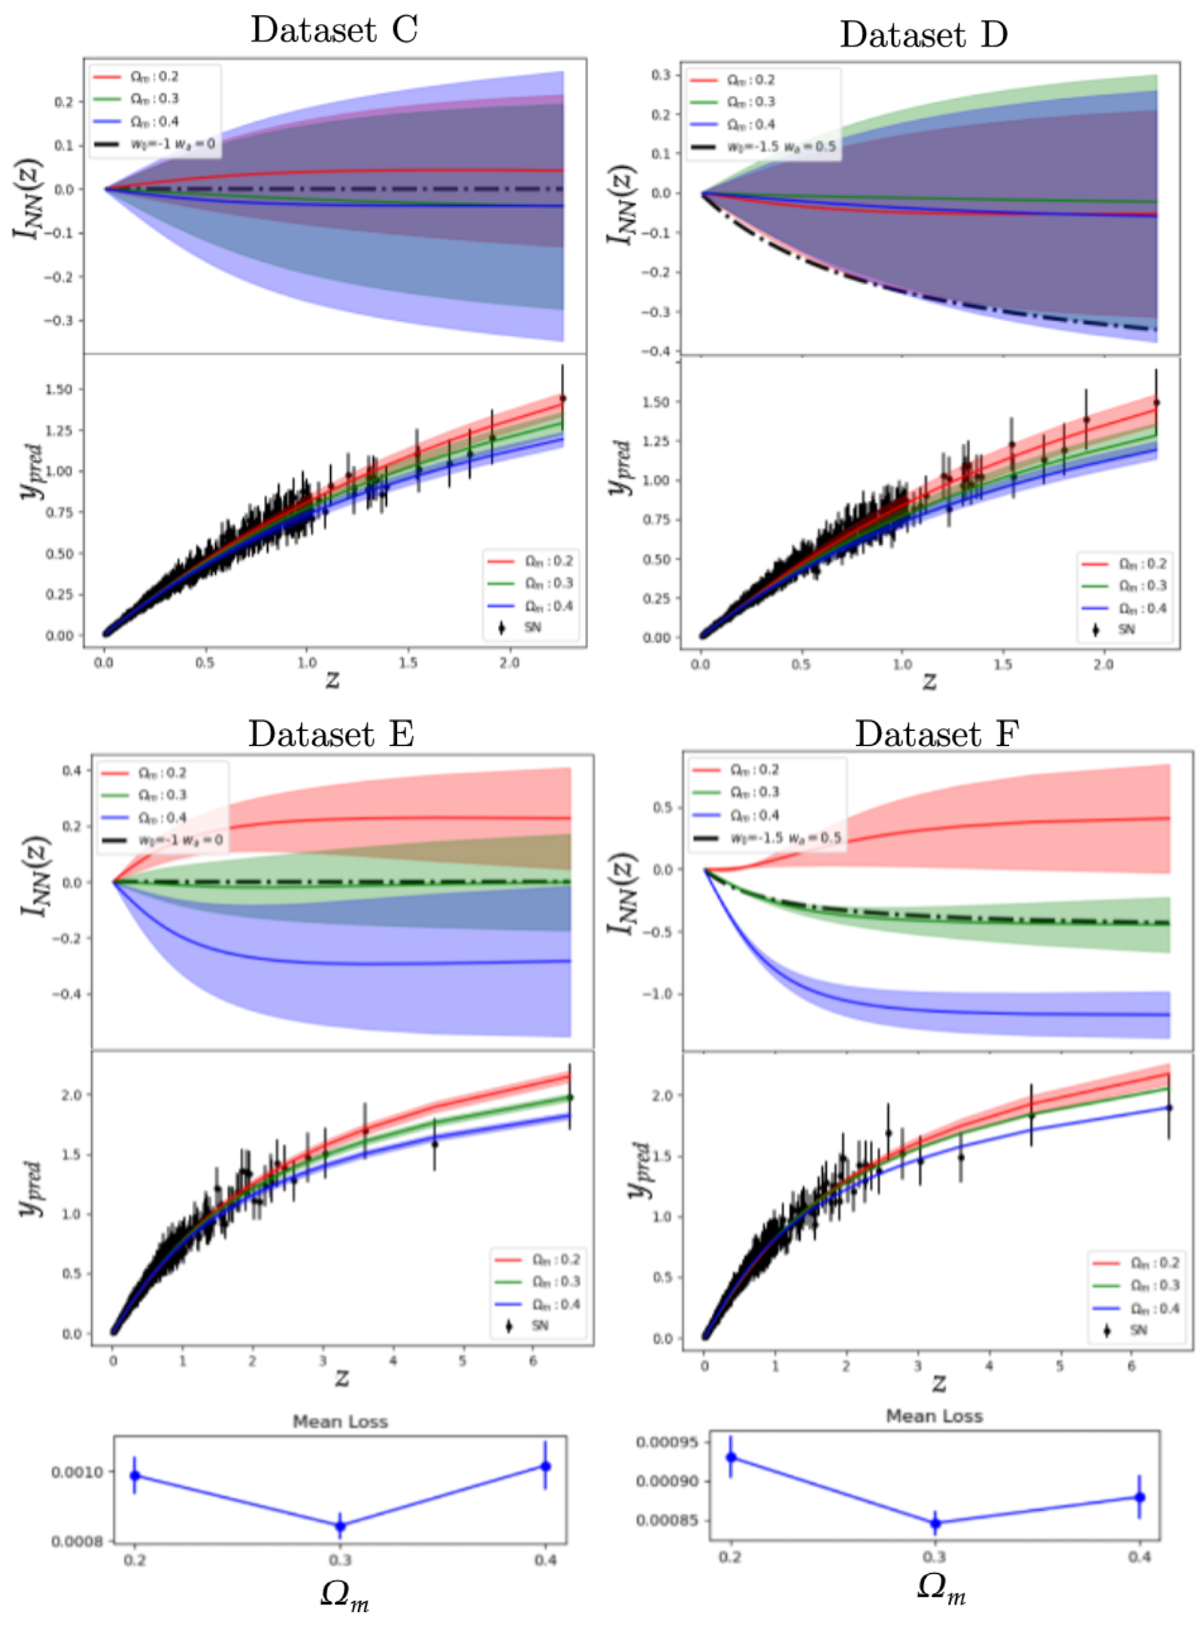
Fig. 1.
Download original image
I(z) Results of the NN analysis of the Hubble diagram of simulated data. Top left: data set C, with the same redshift distribution and dispersion as the Pantheon supernova sample. Bottom left: data set E, where combined Pantheon and quasars are considered. In this case, the NN is able to identify the model assumed for data generation (the green shadowed region contains the exact profile for INN(z), depicted with a dashed line). The corresponding loss function is also shown and displays a minimum at the correct value of ΩM. Top right: Pantheon-like sample assumed for a CPL generative model (data set E). The NN is unable to distinguish between different scenarios (ΛCDM vs. CPL). Bottom right: CPL model with the inclusion of quasars. The degeneracy is resolved, and the NN can correctly identify the underlying model (see the dashed line). The loss shows a minimum for the correct value of ΩM, which yields the green shadowed solution for INN(z) vs. z.
Current usage metrics show cumulative count of Article Views (full-text article views including HTML views, PDF and ePub downloads, according to the available data) and Abstracts Views on Vision4Press platform.
Data correspond to usage on the plateform after 2015. The current usage metrics is available 48-96 hours after online publication and is updated daily on week days.
Initial download of the metrics may take a while.