Fig. 7.
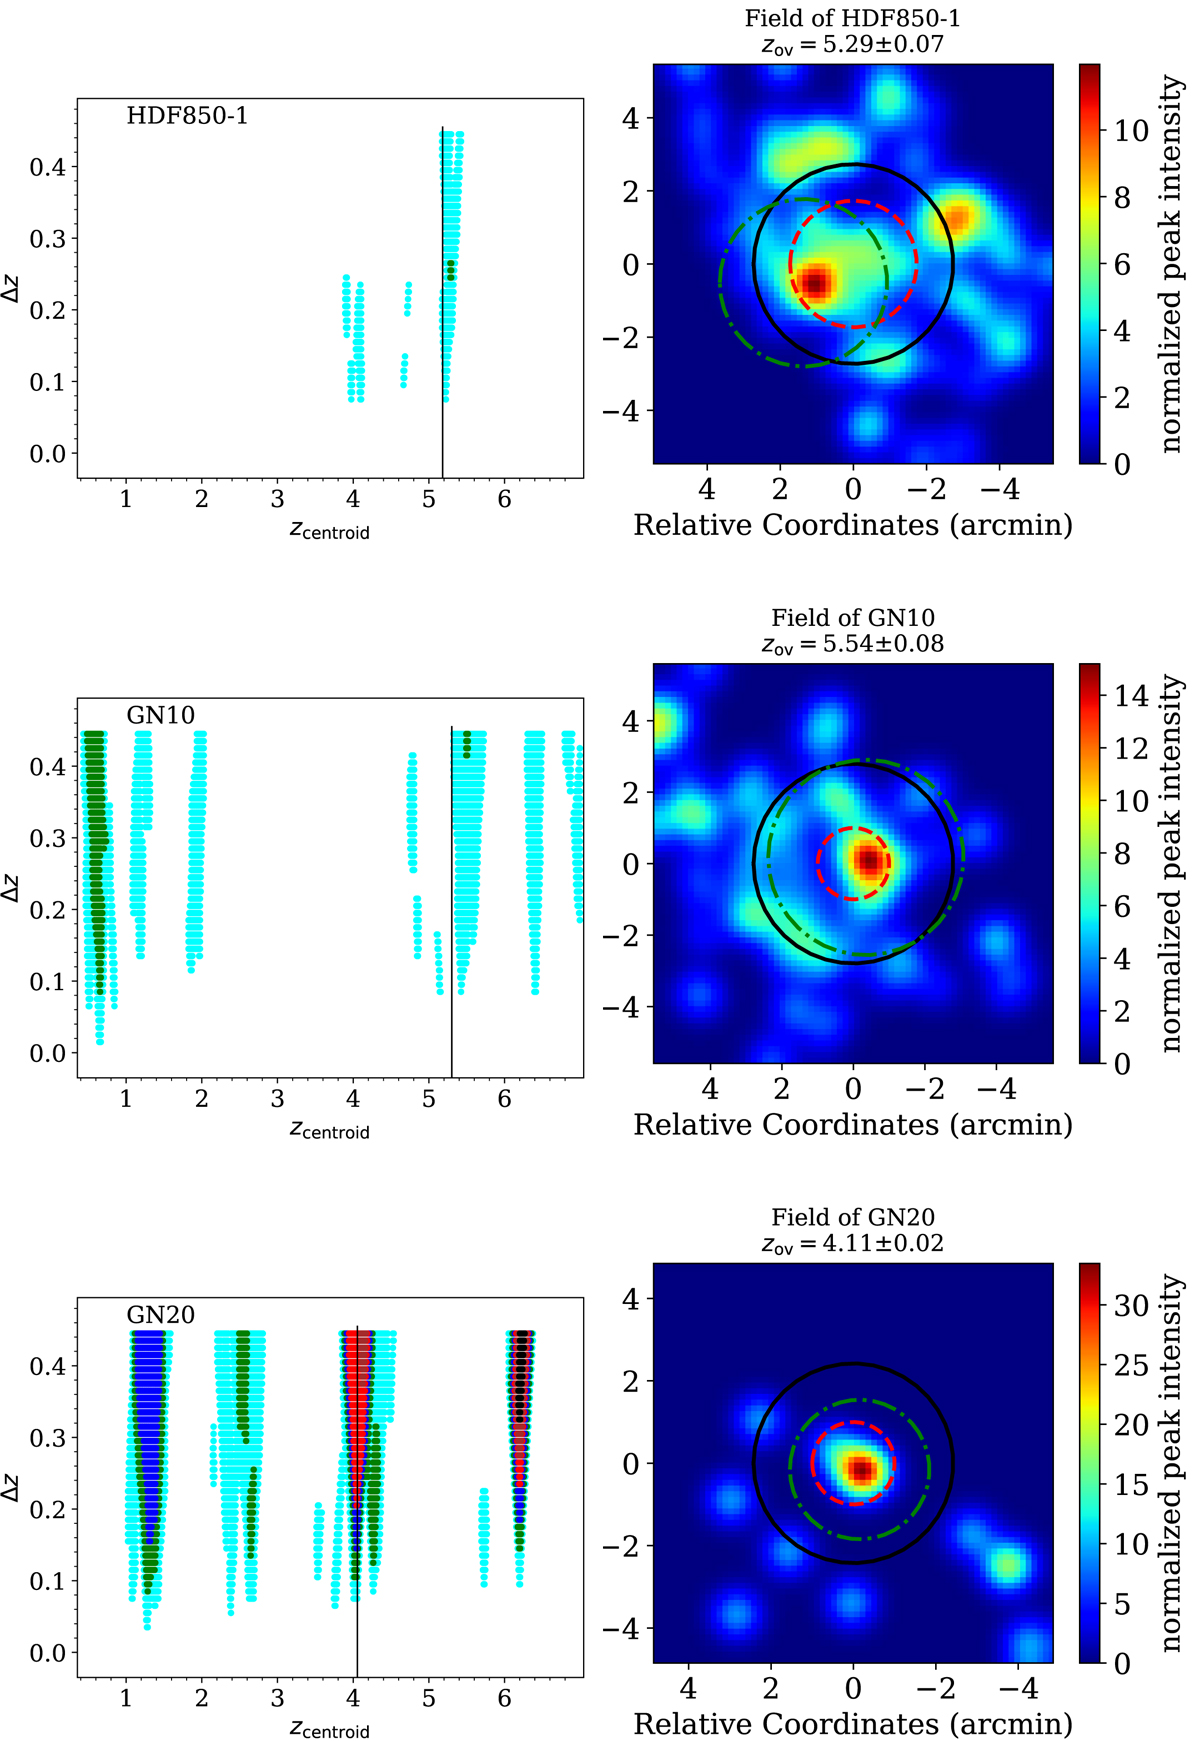
Download original image
PPM plots (left) and density maps (right) of protoclusters detected around z > 4 SMGs using the AH18 (top), B19 (center), and L18 (bottom) catalogs. Left: PPM plots for HDF850.1, GN10, and GN20. The vertical solid lines show the SMG spectroscopic redshifts. Colored dots refer to significance levels > 2σ (cyan), 3σ (green), 4σ (blue), 5σ (red), 6σ (brown), and 7σ (black). Right: Gaussian density maps for the overdensities, centered at the projected space coordinates of the SMGs. The solid black and dashed red circles are centered at the projected space coordinates of the SMGs. The former have a (physical) radius of 1 Mpc, estimated at zov, while the latter, with a radius ℛPPM, denote the region within which the PPM detects the overdensity. The dotted-dashed green circle is centered at the peak of the detection as found by the wavelet transform and has a radius ℛw.
Current usage metrics show cumulative count of Article Views (full-text article views including HTML views, PDF and ePub downloads, according to the available data) and Abstracts Views on Vision4Press platform.
Data correspond to usage on the plateform after 2015. The current usage metrics is available 48-96 hours after online publication and is updated daily on week days.
Initial download of the metrics may take a while.