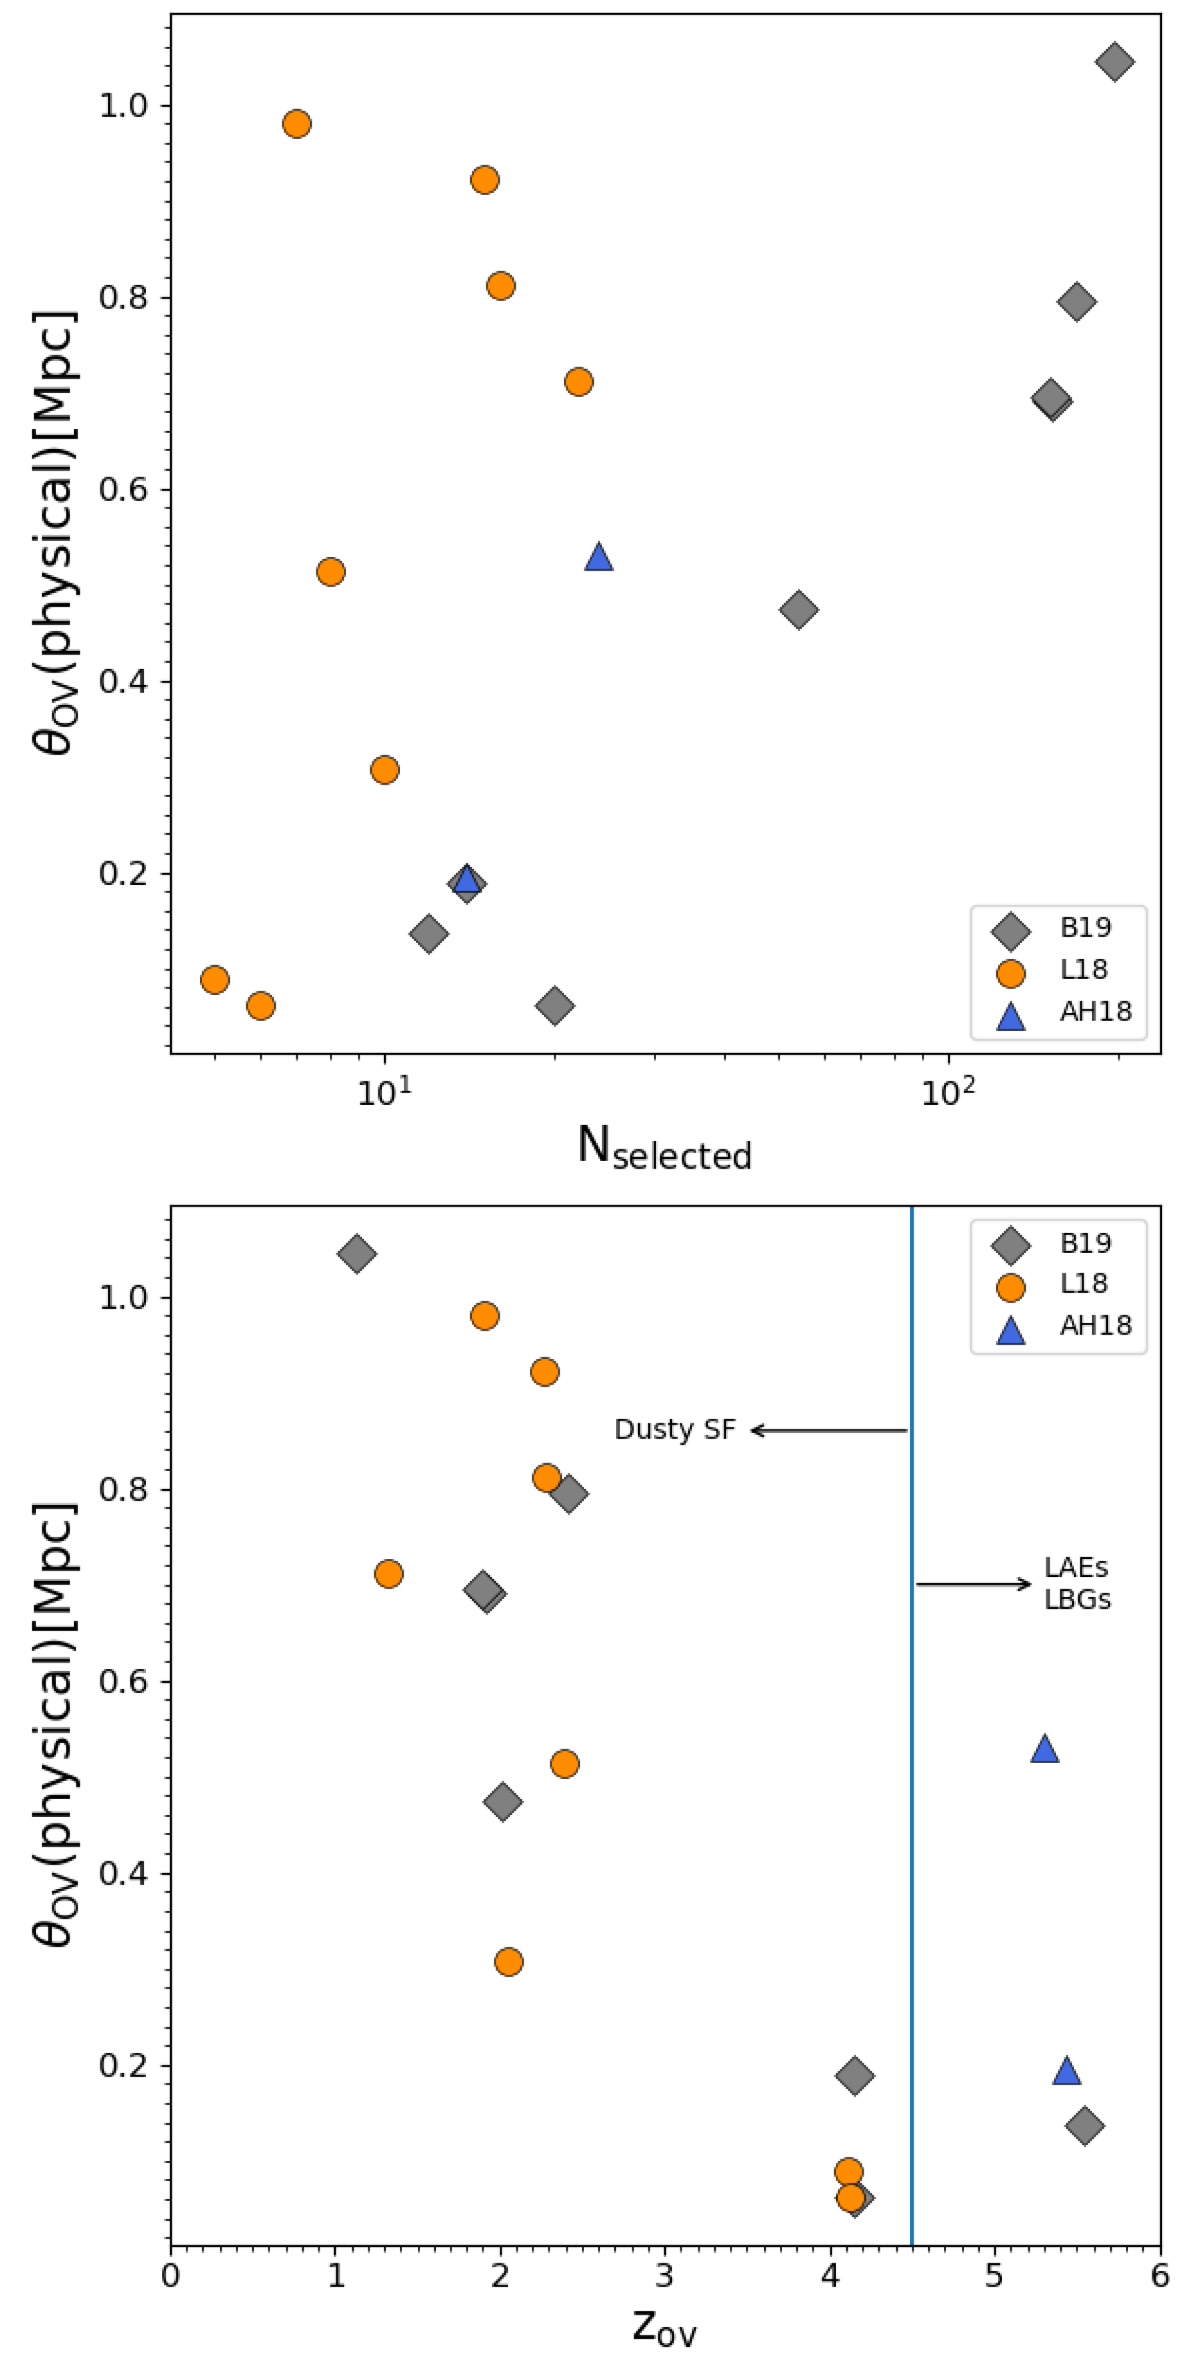
Fig. 6.
Download original image
Projected separation between the SMG coordinates and the overdensity peak as found by the wavelet transform of wPPM as a function of the estimated richness (top) and redshift (bottom) of the overdensity. The vertical line at zov ≳ 4 in the bottom panel is used to indicate the possible transitioning phase in the protocluster galaxy population. The color coding is the same as in Fig. 5.
Current usage metrics show cumulative count of Article Views (full-text article views including HTML views, PDF and ePub downloads, according to the available data) and Abstracts Views on Vision4Press platform.
Data correspond to usage on the plateform after 2015. The current usage metrics is available 48-96 hours after online publication and is updated daily on week days.
Initial download of the metrics may take a while.