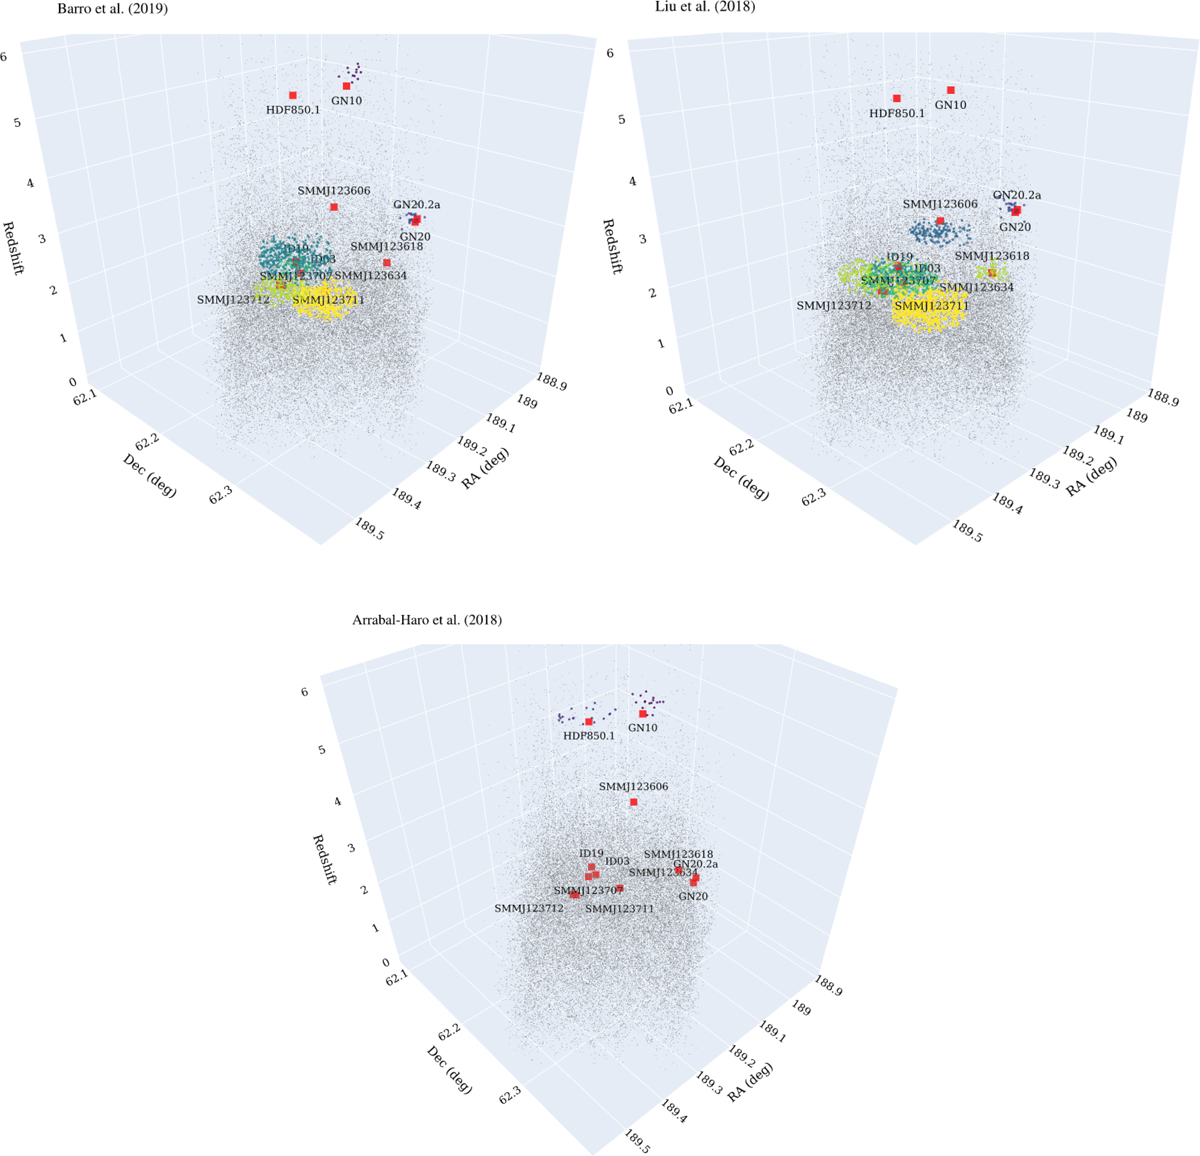
Fig. 3.
Download original image
Distribution of the SMGs and associated protocluster galaxies in the RA, Dec, and redshift space when the B19, L18, and AH18 photometric redshift catalogs are used for the detection of protoclusters. Small gray and colored dots always correspond to sources from the B19 catalog, which is chosen for a better visualization as it is the largest photometric redshift catalog. Red squares show the location of the SMGs in our sample. Colored clouds show the members of the overdensities as identified with the PPM. Protocluster members are color coded in yellow, green, and blue according to their increasing redshift. Interactive 3D plots for all three photometric redshift catalogs are available online.
Current usage metrics show cumulative count of Article Views (full-text article views including HTML views, PDF and ePub downloads, according to the available data) and Abstracts Views on Vision4Press platform.
Data correspond to usage on the plateform after 2015. The current usage metrics is available 48-96 hours after online publication and is updated daily on week days.
Initial download of the metrics may take a while.