Fig. 4.
Download original image
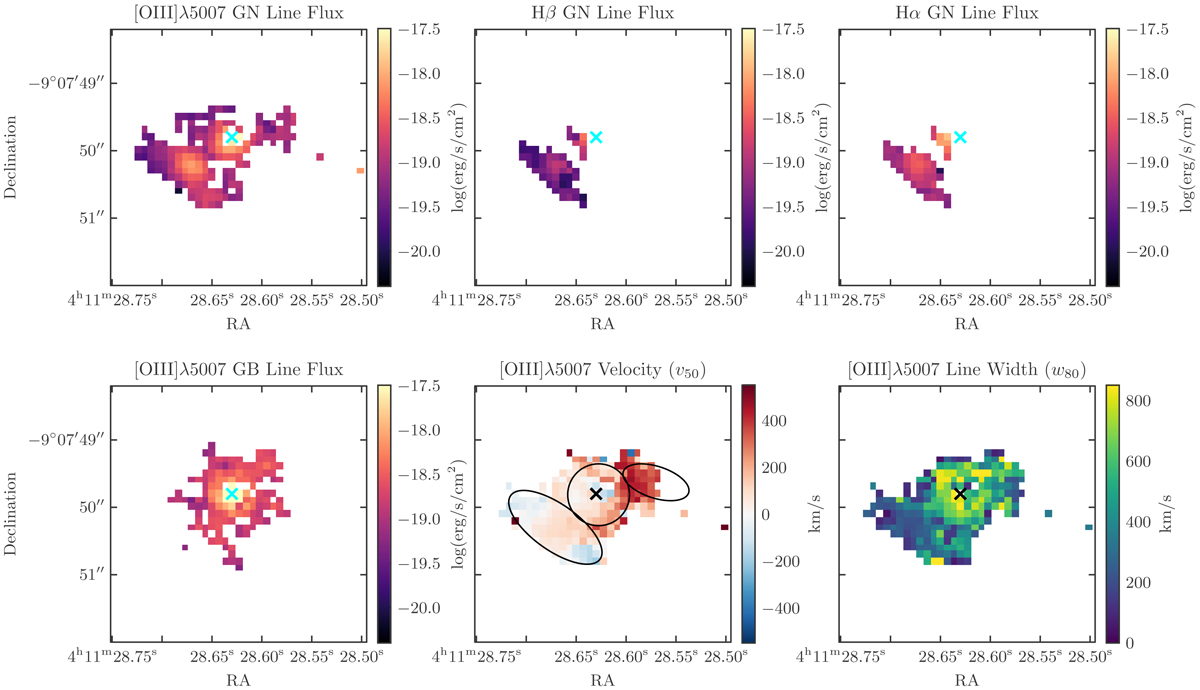
Flux and kinematic maps for DELS J0411–0907, after the subtraction of the quasar emission using the N&B subtraction technique. The top panels show the flux of the narrow component of the [O III] λ5007, Hβ, and Hα lines (GN), as fit by a Gaussian. The bottom left panel shows the flux of the broader GB component of the [O III] λ5007 line, a second Gaussian with a larger σ. The lower middle and right panels show our kinematic maps, showing the non-parametric central velocity of the line (v50; middle) and the line width (w80; right). As these are non-parametric, this combines both the GN and GB components. We describe our method for creating these maps in Sect. 2.3.4. The black ellipses in the lower middle panel depict the regions as in Fig. 5.
Current usage metrics show cumulative count of Article Views (full-text article views including HTML views, PDF and ePub downloads, according to the available data) and Abstracts Views on Vision4Press platform.
Data correspond to usage on the plateform after 2015. The current usage metrics is available 48-96 hours after online publication and is updated daily on week days.
Initial download of the metrics may take a while.