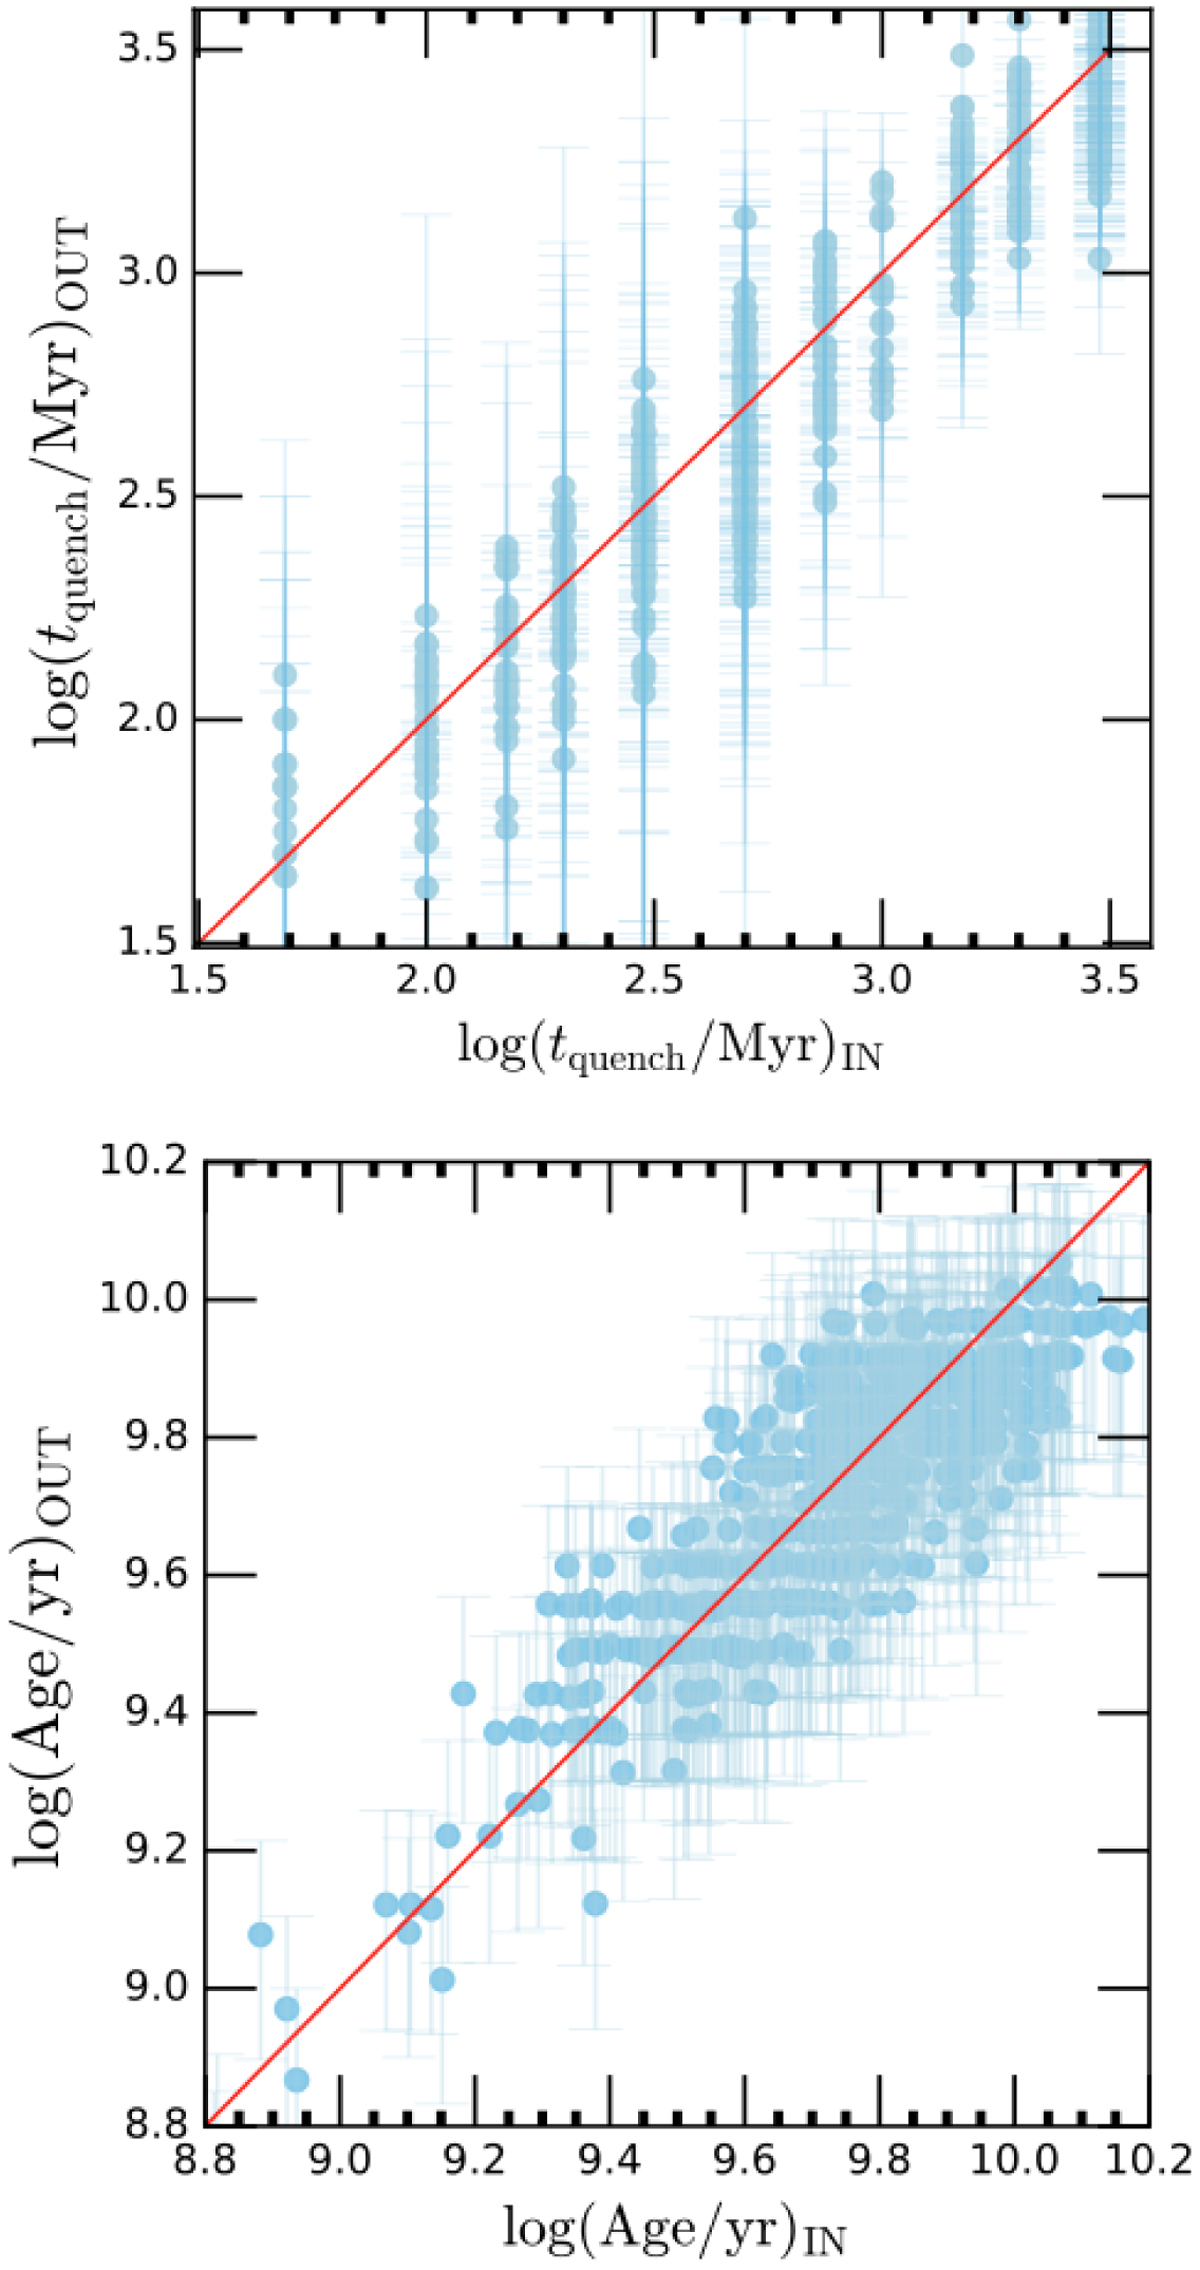
Fig. B.1.
Download original image
Results of the Bayesian-like mock analysis with CIGALE. The ‘true’ values (labelled ‘IN’) were used to build the mock catalogue and are shown on the x-axes, while the SED fitting outputs (labelled ‘OUT’) are shown on the y-axes. The one-to-one relation is indicated as a solid red line. This exercise ensures that the stellar ages and times since quenching obtained from our SED fitting method are well constrained with the data at hand.
Current usage metrics show cumulative count of Article Views (full-text article views including HTML views, PDF and ePub downloads, according to the available data) and Abstracts Views on Vision4Press platform.
Data correspond to usage on the plateform after 2015. The current usage metrics is available 48-96 hours after online publication and is updated daily on week days.
Initial download of the metrics may take a while.