Open Access
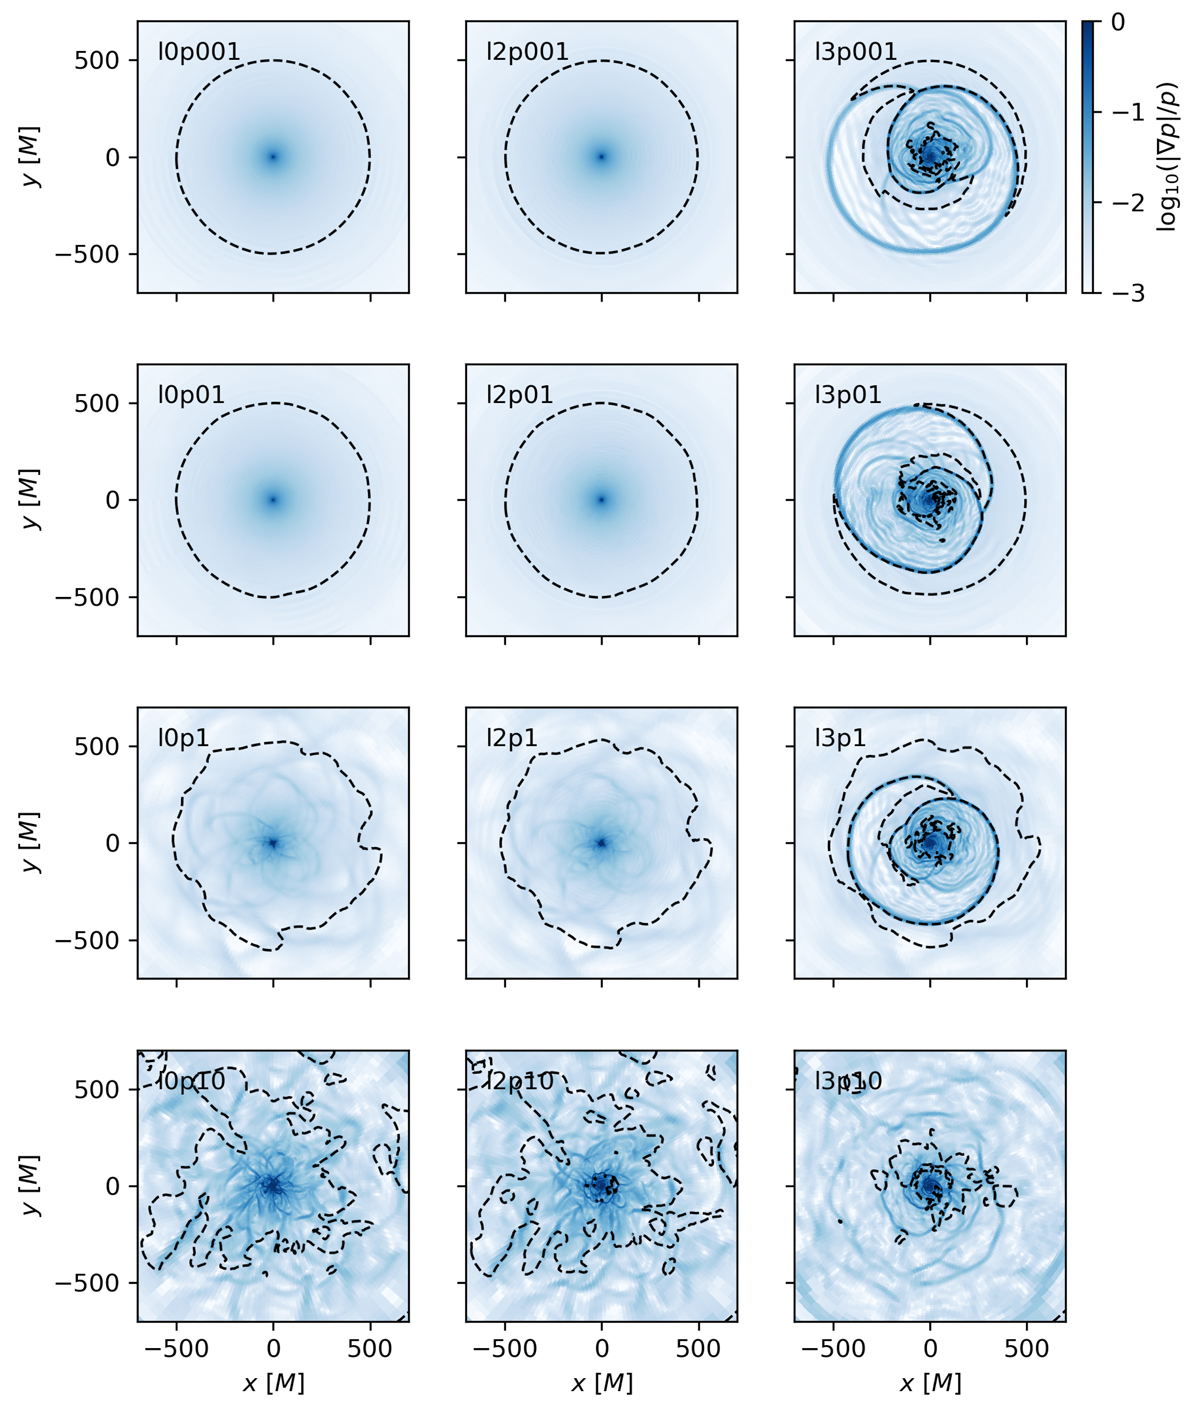
Fig. 6.
Download original image
Shocks and sonic surfaces for all simulations at t = 60 000 M. The color scale displays the relative pressure gradient, which is used as a proxy for shock locations, and the dashed lines indicate the static limits of the sonic metric.
Current usage metrics show cumulative count of Article Views (full-text article views including HTML views, PDF and ePub downloads, according to the available data) and Abstracts Views on Vision4Press platform.
Data correspond to usage on the plateform after 2015. The current usage metrics is available 48-96 hours after online publication and is updated daily on week days.
Initial download of the metrics may take a while.