Open Access
Fig. 4.
Download original image
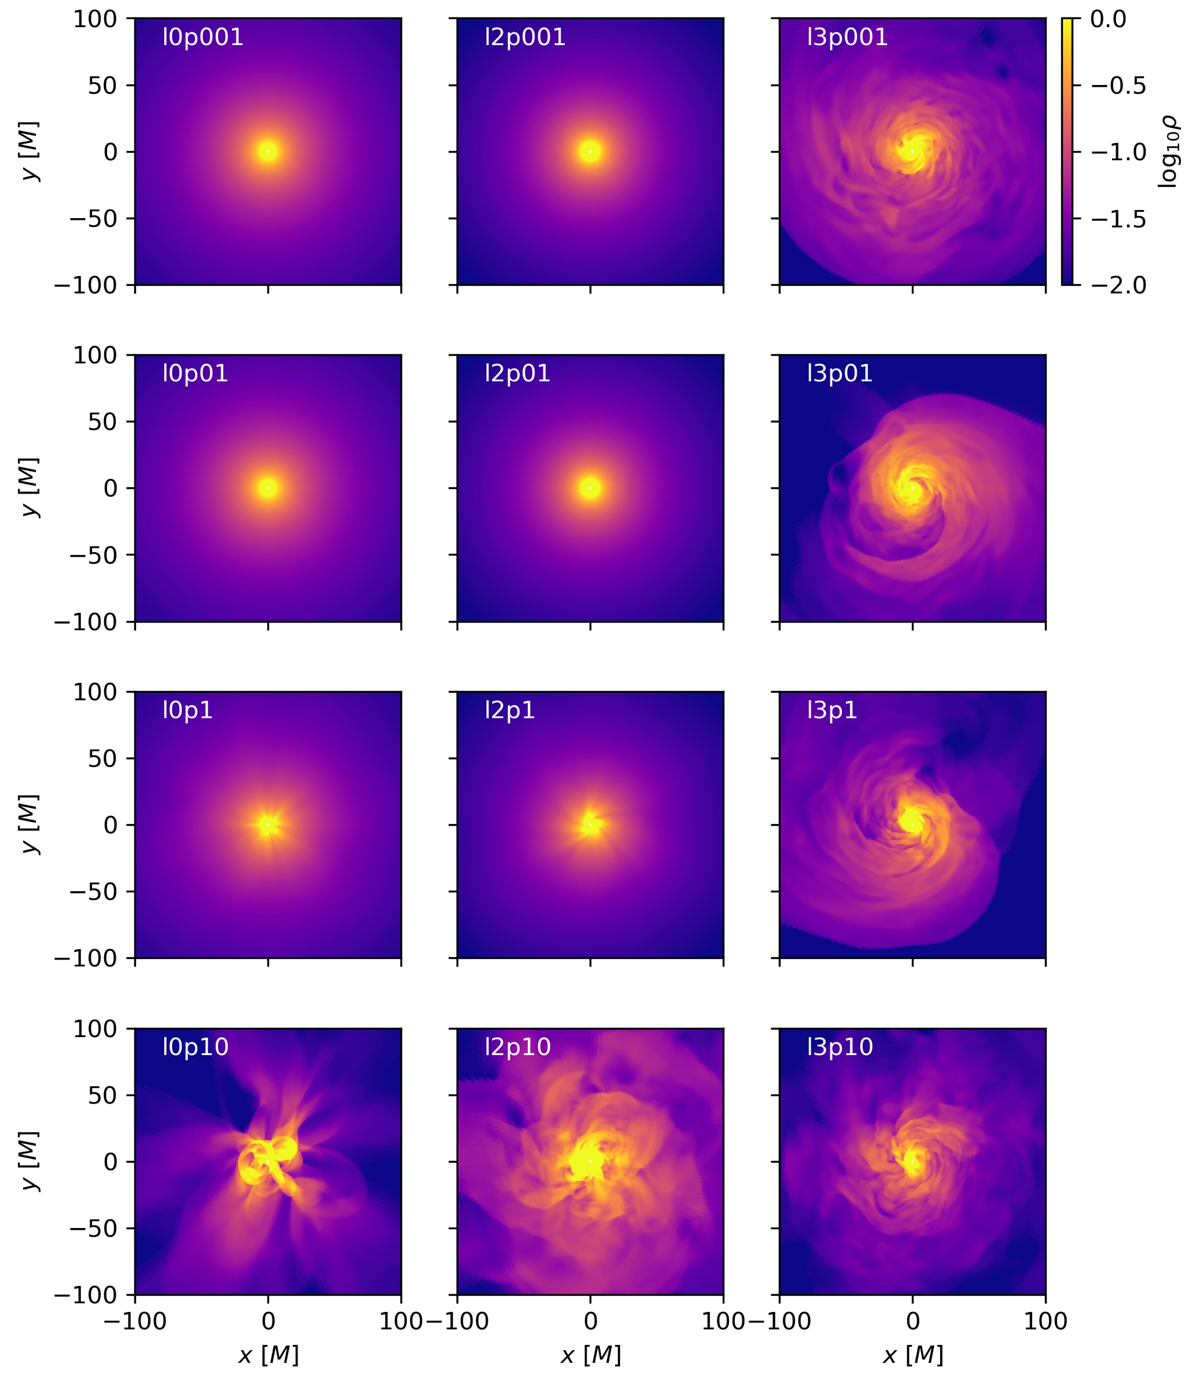
Logarithmic density maps for all simulations at t = 60 000 M on the equatorial plane. Panels are organized in the same way as simulations in Table 1, that is, increasing angular momentum from left to right and perturbation amplitude from top to bottom. Movies of simulations l0p10, l2p10, and l3p10, are available online.
Current usage metrics show cumulative count of Article Views (full-text article views including HTML views, PDF and ePub downloads, according to the available data) and Abstracts Views on Vision4Press platform.
Data correspond to usage on the plateform after 2015. The current usage metrics is available 48-96 hours after online publication and is updated daily on week days.
Initial download of the metrics may take a while.