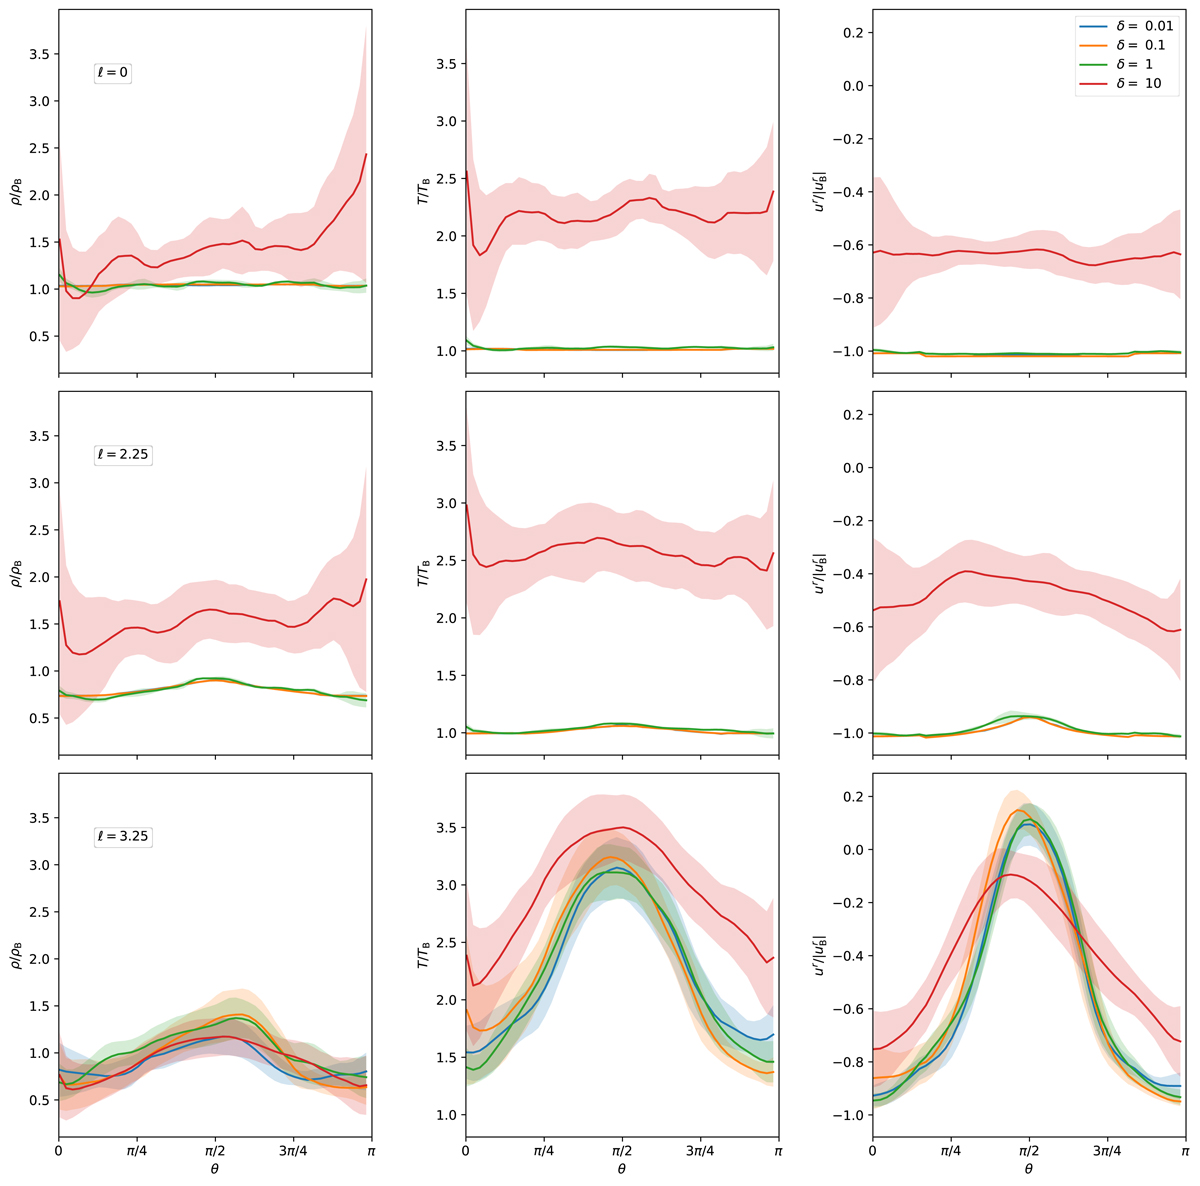
Fig. 3.
Download original image
Angular profiles of density (left column), dimensionless temperature (middle column), and radial component for the four-velocity (right column) measured at r = 20 M, averaged over the time interval t/M ∈ [50 000, 60 000] for all simulations. All quantities are normalized to those of the Bondi-Michel solution at the same radius. Similarly to what is shown in Fig. 2, the rows from top to bottom correspond to ℓ0 = 0, ℓ0 = 2.25, and ℓ0 = 3.25, and the different values of δ are indicated by the different colors. The shaded regions indicate the standard deviation. In most of the panels, the profiles for δ = 0.01 and δ = 0.1 overlap completely.
Current usage metrics show cumulative count of Article Views (full-text article views including HTML views, PDF and ePub downloads, according to the available data) and Abstracts Views on Vision4Press platform.
Data correspond to usage on the plateform after 2015. The current usage metrics is available 48-96 hours after online publication and is updated daily on week days.
Initial download of the metrics may take a while.