Fig. 2.
Download original image
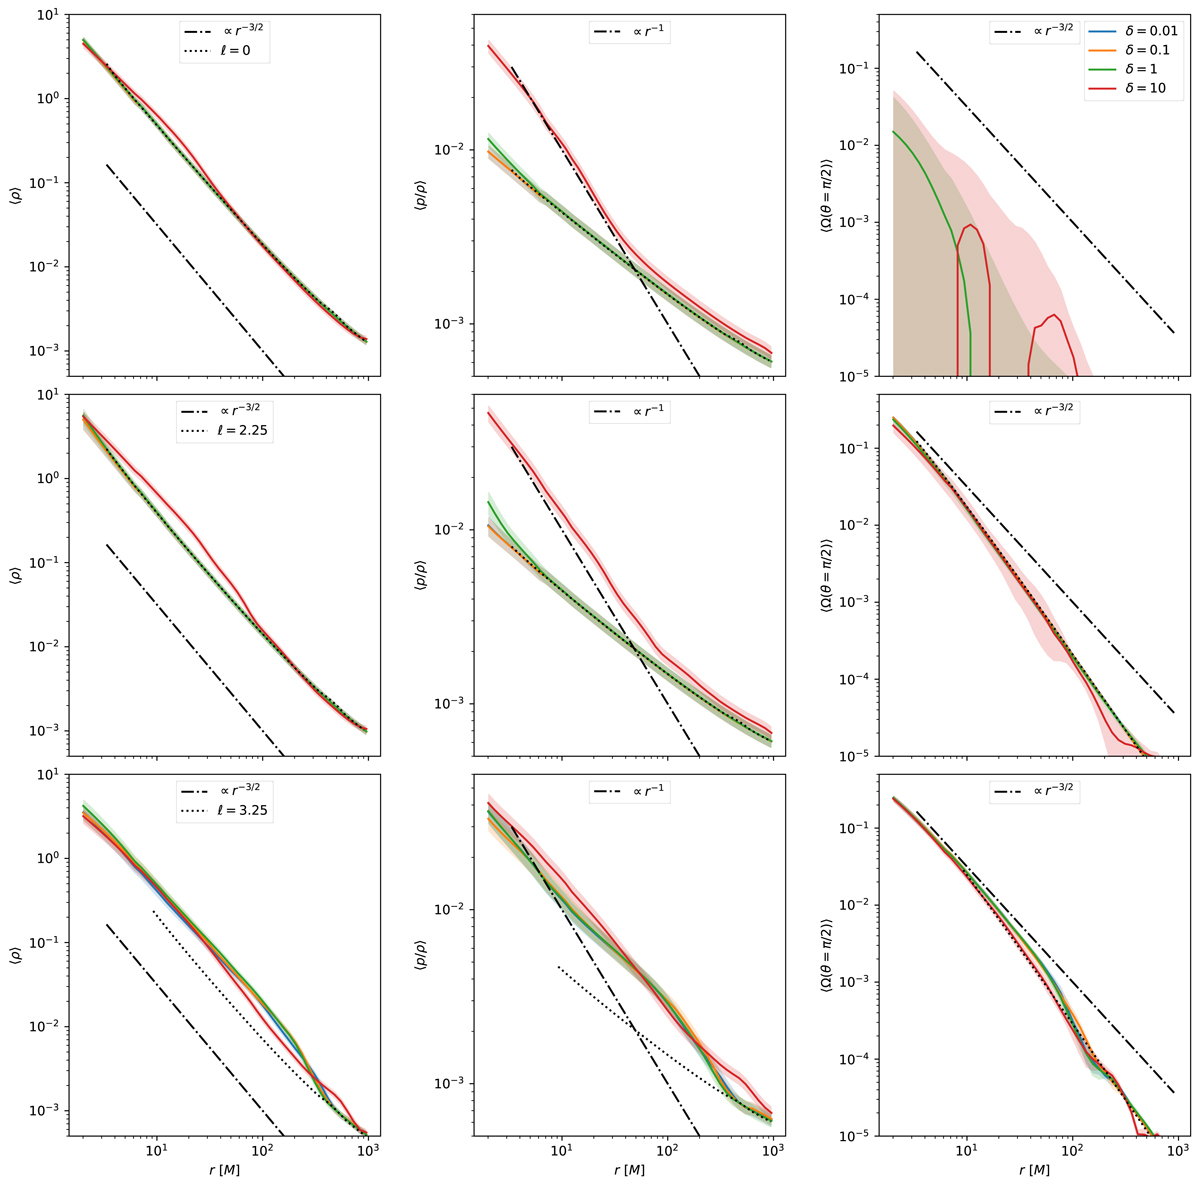
Radial profiles of density (left column), dimensionless temperature (middle column), and equatorial angular velocity (right column) averaged over angle and time in the interval t/M ∈ [50 000, 60 000] for all simulations. From top to bottom, the rows correspond to ℓ0 = 0, ℓ0 = 2.25, and ℓ0 = 3.25, and the different values of δ are indicated by the different colors. The shaded regions indicate the standard deviation. The dot-dashed lines show the power laws expected for an ADAF with ![]() and no radiative cooling, and the dashed lines are the profiles for the unperturbed configurations with constant angular momentum used as initial condition. In most of the panels, the profiles for δ = 0.01 and δ = 0.1 overlap completely.
and no radiative cooling, and the dashed lines are the profiles for the unperturbed configurations with constant angular momentum used as initial condition. In most of the panels, the profiles for δ = 0.01 and δ = 0.1 overlap completely.
Current usage metrics show cumulative count of Article Views (full-text article views including HTML views, PDF and ePub downloads, according to the available data) and Abstracts Views on Vision4Press platform.
Data correspond to usage on the plateform after 2015. The current usage metrics is available 48-96 hours after online publication and is updated daily on week days.
Initial download of the metrics may take a while.