Fig. 7
Download original image
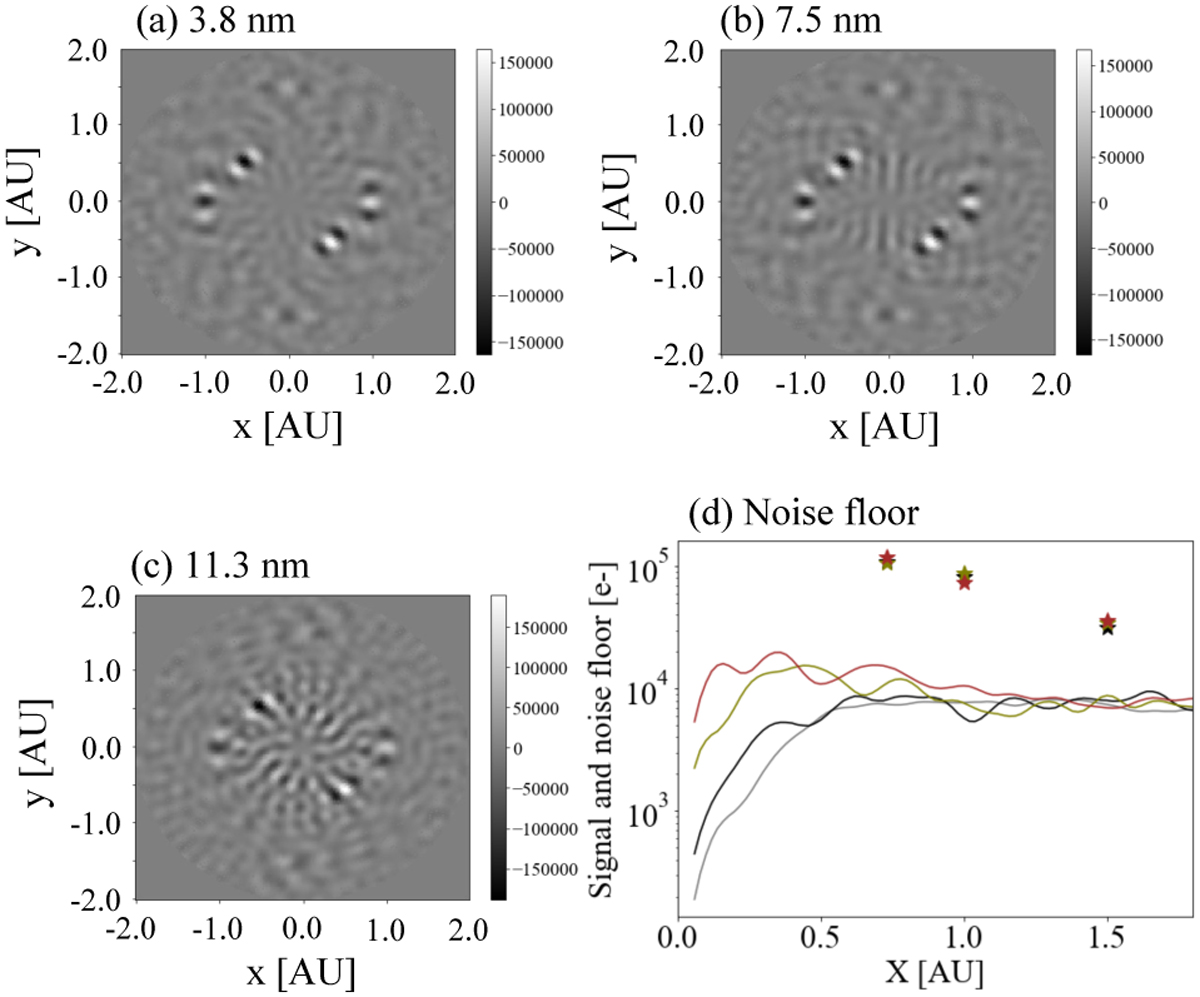
Image reconstruction under large systematic noises. Panels a, b, and c show reconstructed images for systematic OPD rms errors of 3.8, 7.5, and 11.3 nm, respectively. Panel d shows the noise floors for systematic OPD errors of 3.8 (black), 7.5 (yellow), and 11.3 nm (brown) were compared with the planetary signals (star symbol). The noise floor for each OPD error was calculated for a reconstructed 2D image without the planetary signals. The gray line shows the noise floor for the ideal case (i.e., only the shot noise) as a reference. Because the reconstructed planetary signals are slightly affected by the OPD error, the black, yellow, and brown star symbols represent the planetary signals for OPD rms errors of 3.8, 7.5, and 11.3 nm, respectively.
Current usage metrics show cumulative count of Article Views (full-text article views including HTML views, PDF and ePub downloads, according to the available data) and Abstracts Views on Vision4Press platform.
Data correspond to usage on the plateform after 2015. The current usage metrics is available 48-96 hours after online publication and is updated daily on week days.
Initial download of the metrics may take a while.