Fig. 5
Download original image
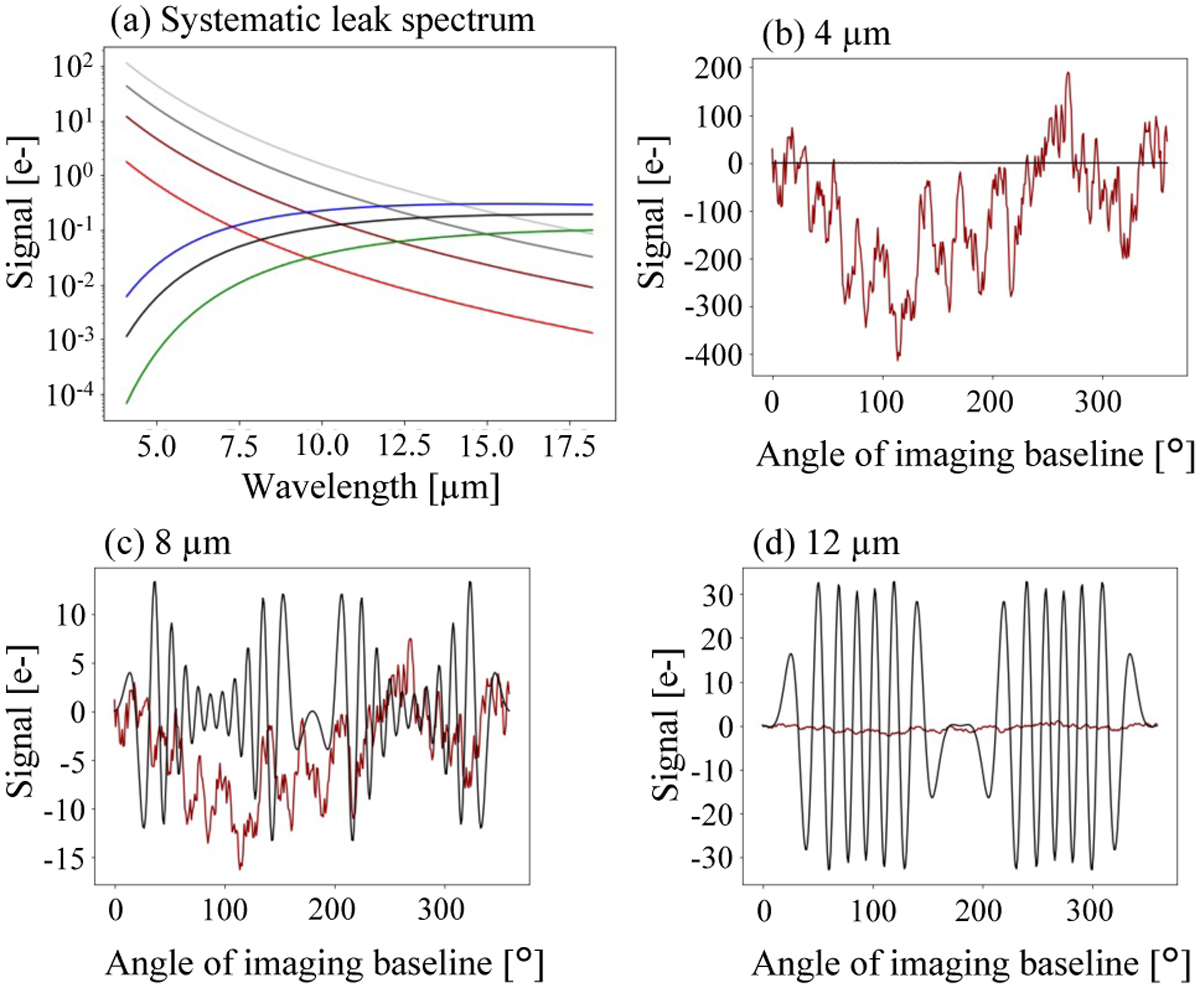
Systematic stellar noise. Panel a shows comparison of signals of the three planets P1 (black), P2 (blue), and P3 (green) with the nulled stellar leaks left in the subtraction of the two chop states over the entire wavelength range. The red, brown, gray, and light gray lines represent the stellar leaks for systematic OPD rms errors of 0.75, 3.8, 7.5, and 11.3 nm. Panels b, c, and d show fluctuations in the stellar leak due to an OPD rms error of 0.75 nm (red) and the demodulated signal of planet P1 (black) at wavelengths of 4, 8, and 12 µm, respectively. The integration time of each data point is 550 s.
Current usage metrics show cumulative count of Article Views (full-text article views including HTML views, PDF and ePub downloads, according to the available data) and Abstracts Views on Vision4Press platform.
Data correspond to usage on the plateform after 2015. The current usage metrics is available 48-96 hours after online publication and is updated daily on week days.
Initial download of the metrics may take a while.