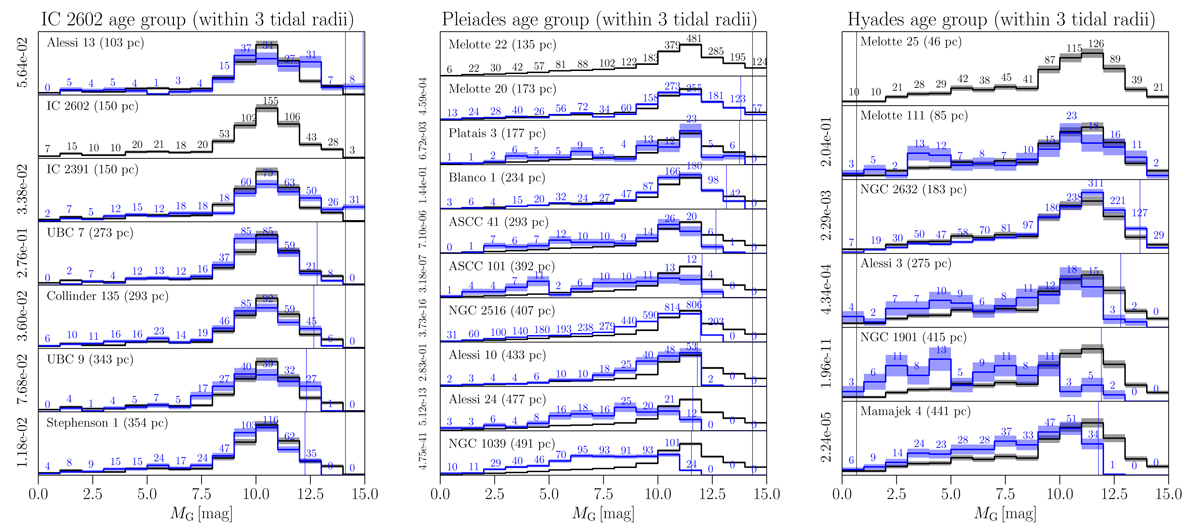
Fig. 8.
Download original image
Luminosity functions for clusters in each age group. These functions have been normalised such that the area under the curve equals one. We include all members within 3 tidal radii. The solid black lines show the benchmark cluster, and shaded areas represent the Poissonian uncertainty. We sort the clusters by their distance to more easily trace the completeness limit (denoted by vertical lines). The y-axes show the p-value from the Kolmogorov–Smirnov comparison, with the benchmark cluster within the common completeness limits.
Current usage metrics show cumulative count of Article Views (full-text article views including HTML views, PDF and ePub downloads, according to the available data) and Abstracts Views on Vision4Press platform.
Data correspond to usage on the plateform after 2015. The current usage metrics is available 48-96 hours after online publication and is updated daily on week days.
Initial download of the metrics may take a while.