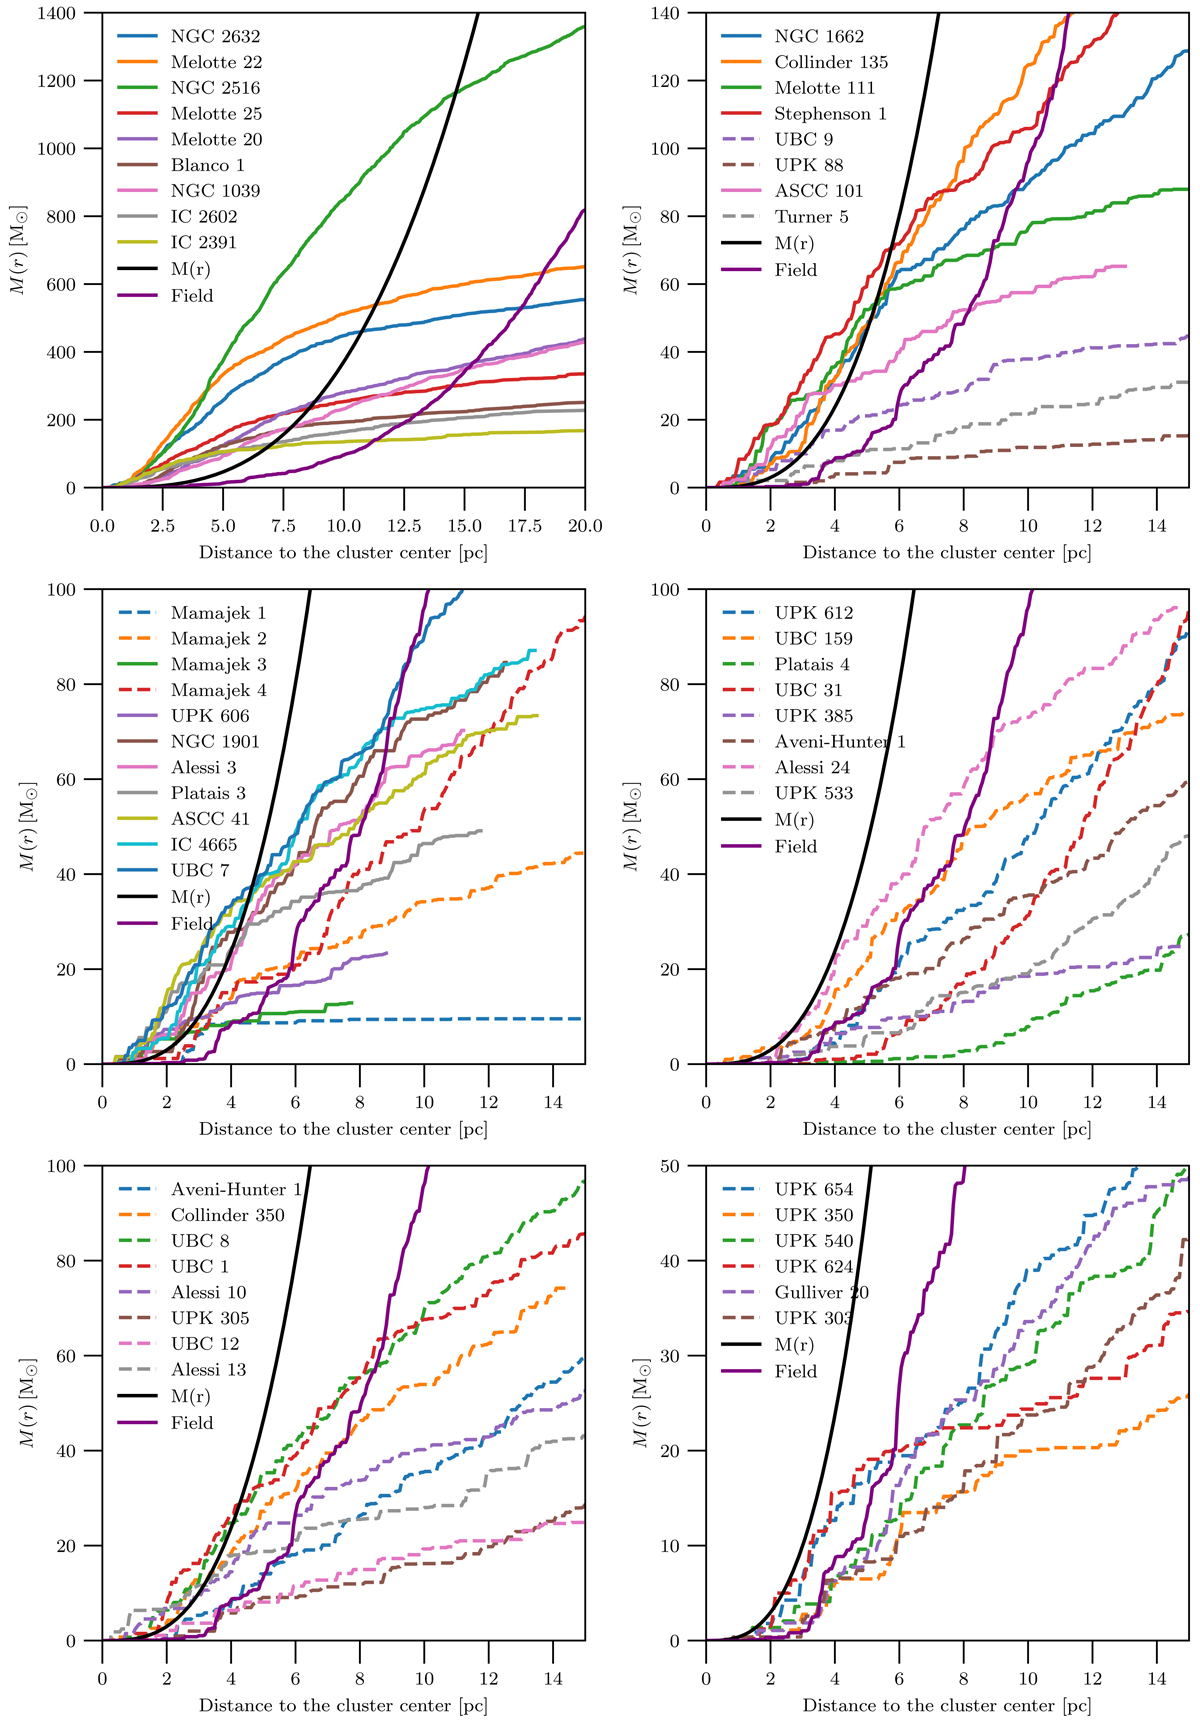
Fig. 4.
Download original image
Cumulative radial mass distributions for all clusters. These plots were used to determine tidal radii. The term M(r) is a theoretical curve that describes the location of the first Lagrange point. The dashed lines represent clusters whose tidal radii we could not determine with our technique, so we set their characteristic radii manually.
Current usage metrics show cumulative count of Article Views (full-text article views including HTML views, PDF and ePub downloads, according to the available data) and Abstracts Views on Vision4Press platform.
Data correspond to usage on the plateform after 2015. The current usage metrics is available 48-96 hours after online publication and is updated daily on week days.
Initial download of the metrics may take a while.