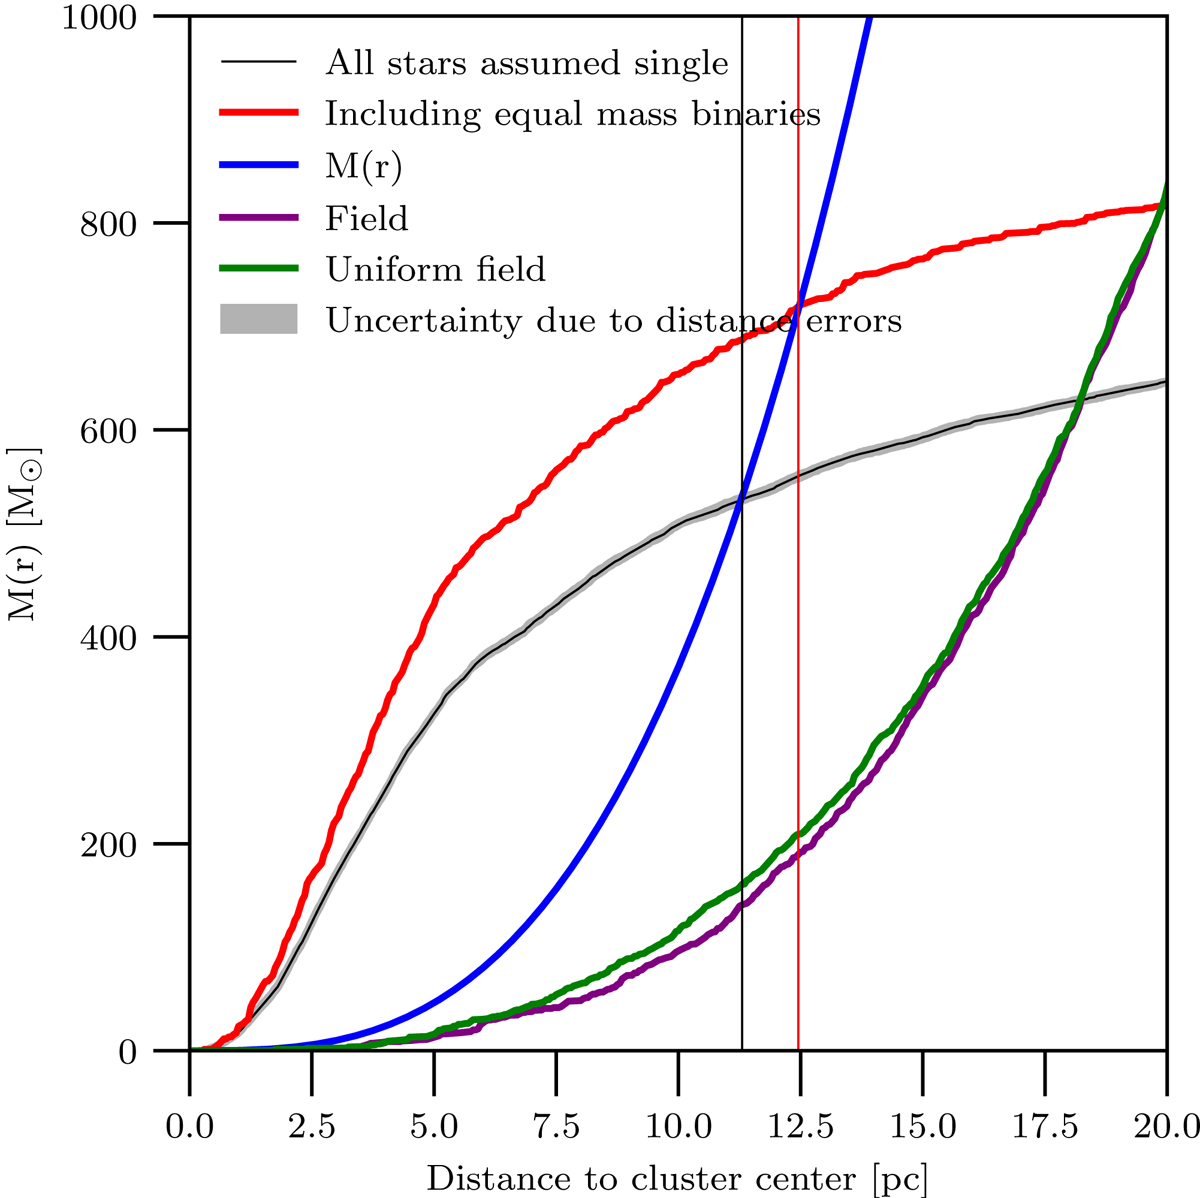
Fig. 2.
Download original image
Tidal radius determined by a cross-section between the cumulative radial mass distribution of the cluster and M(r) from Eq. (8) (blue line). The tidal radius for single stars (black) represents a minimal value, while a synthetic sample where all binaries have an equal mass (red) indicates the upper limit. The difference between these tidal radii is about 10%. The field distribution was added for comparison (purple and green for the actual and simulated field, respectively; see Sect. 2.4).
Current usage metrics show cumulative count of Article Views (full-text article views including HTML views, PDF and ePub downloads, according to the available data) and Abstracts Views on Vision4Press platform.
Data correspond to usage on the plateform after 2015. The current usage metrics is available 48-96 hours after online publication and is updated daily on week days.
Initial download of the metrics may take a while.