Fig. 1.
Download original image
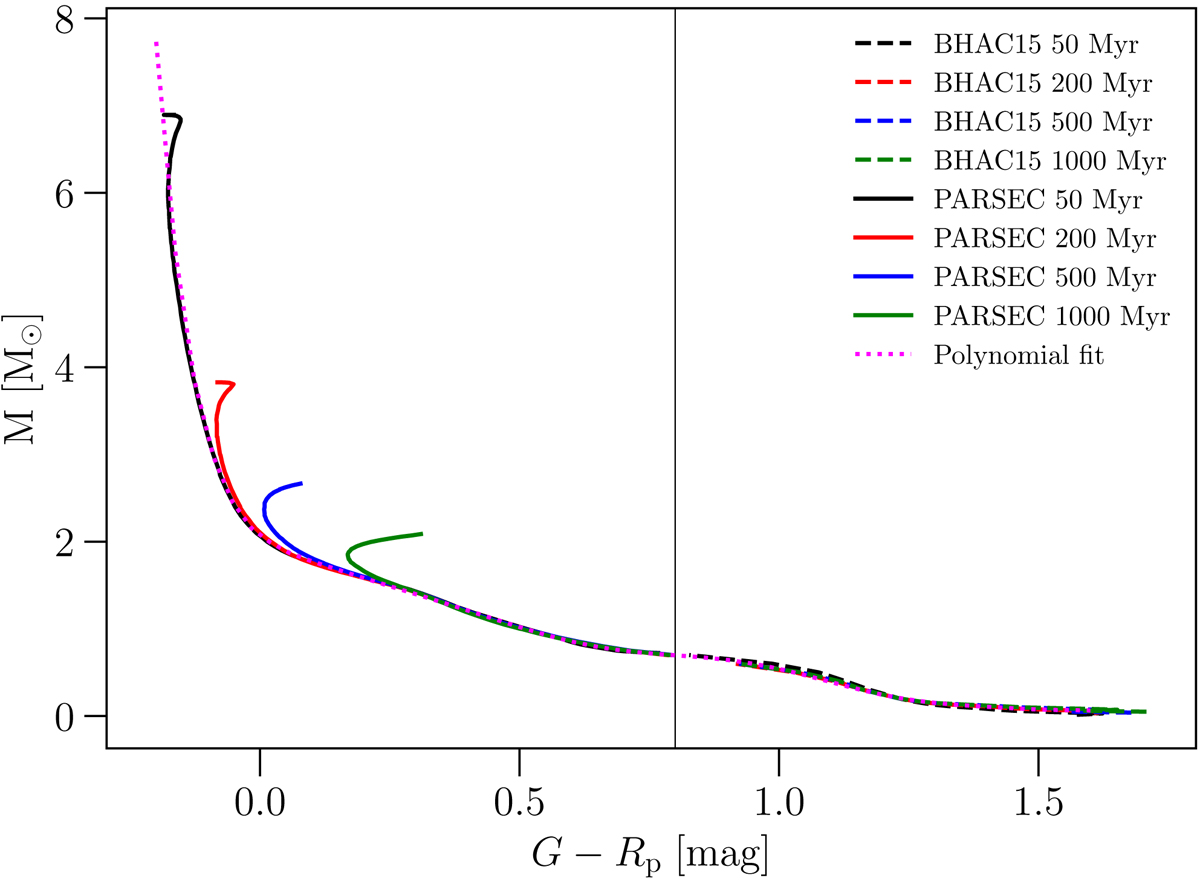
Comparison of isochrones for a range of ages from 50 Myr to 1 Gyr for the BHAC15 (dashed lines) and PARSEC models (solid lines). The polynomial fit used as a colour–mass relation is shown in magenta. While we only plot the relation for G − RP > −0.2, the fit extends to bluer colours in order to cover the most massive stars in our input catalogue.
Current usage metrics show cumulative count of Article Views (full-text article views including HTML views, PDF and ePub downloads, according to the available data) and Abstracts Views on Vision4Press platform.
Data correspond to usage on the plateform after 2015. The current usage metrics is available 48-96 hours after online publication and is updated daily on week days.
Initial download of the metrics may take a while.