Open Access
Fig. 9
Download original image
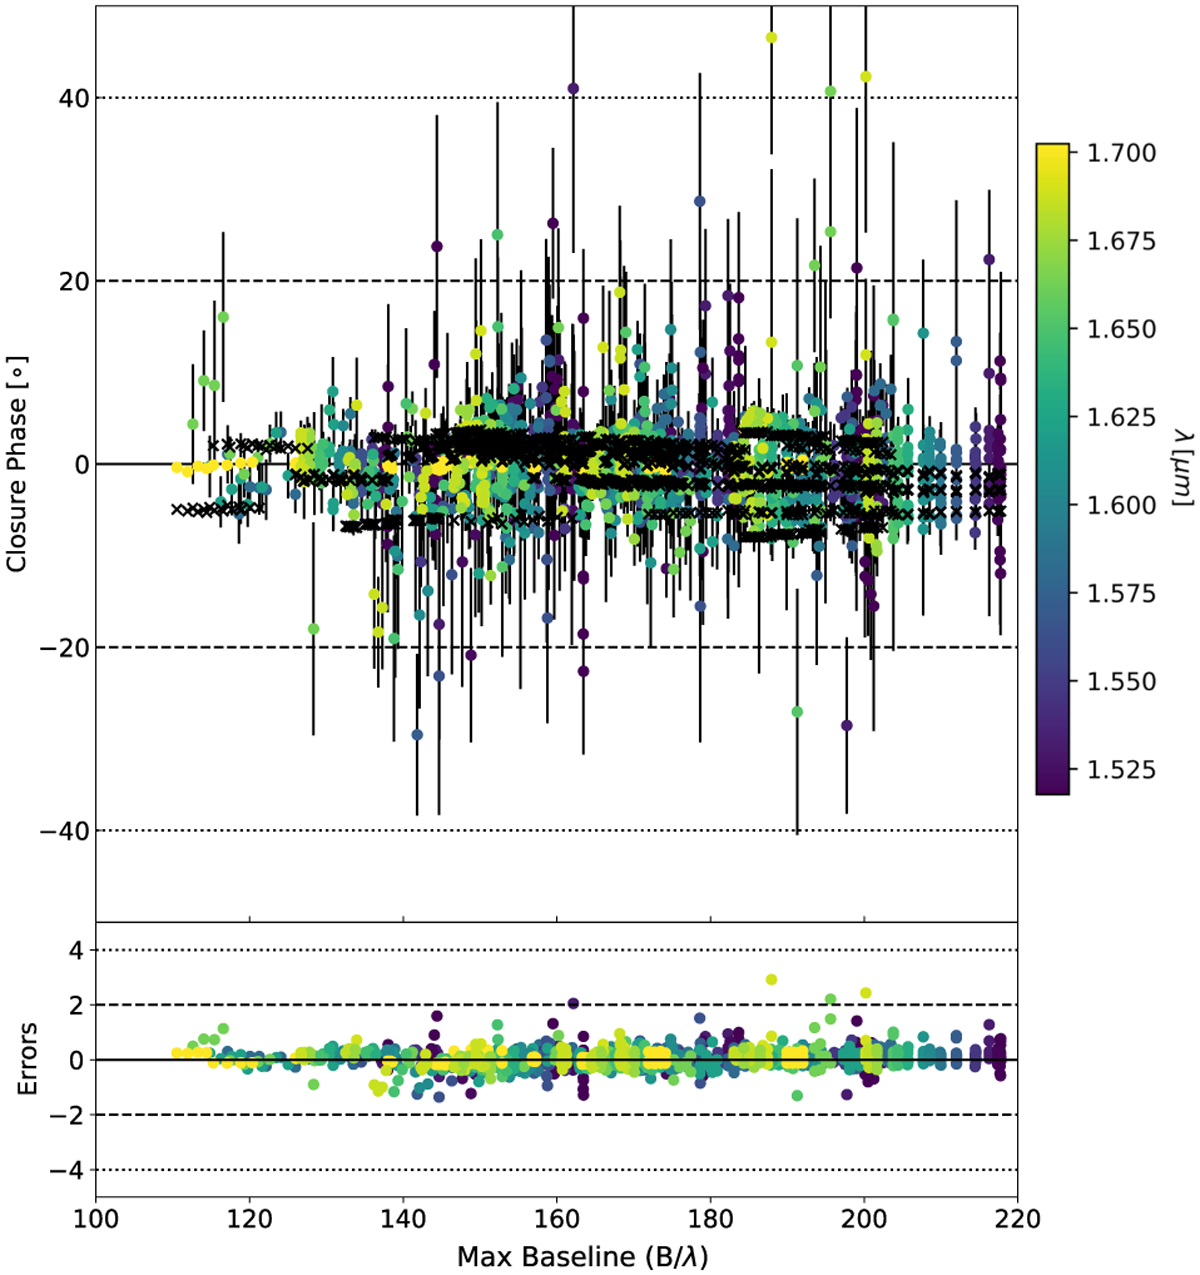
Black crosses are the closure phase data obtained with MIRC-X. Overlaid as coloured points are the TORUS model closure phases; the colours represent the wavelength of the spectral channels and follows the same convention as other plots in this work. Below in black points are the normalised residual errors of the fit.
Current usage metrics show cumulative count of Article Views (full-text article views including HTML views, PDF and ePub downloads, according to the available data) and Abstracts Views on Vision4Press platform.
Data correspond to usage on the plateform after 2015. The current usage metrics is available 48-96 hours after online publication and is updated daily on week days.
Initial download of the metrics may take a while.