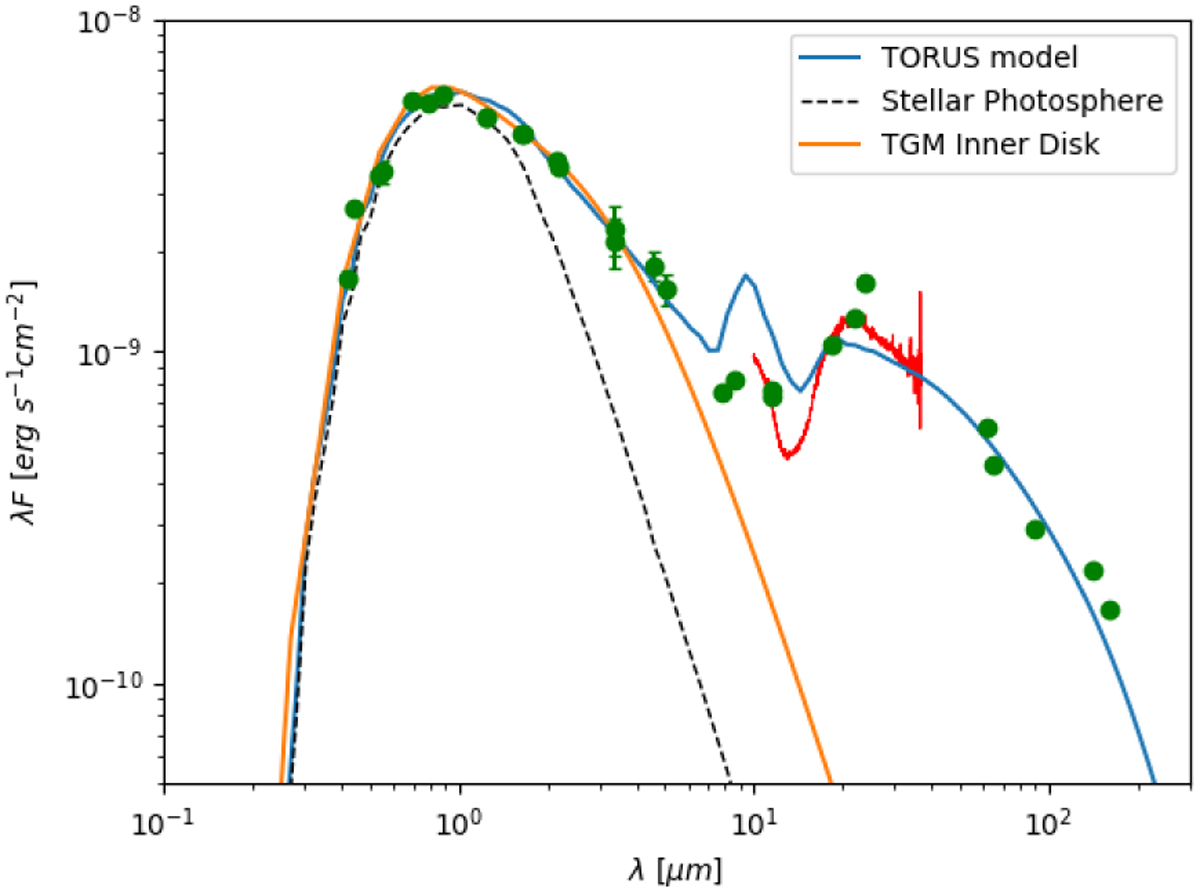
Fig. 6
Download original image
Spectral energy distribution of SU Aurigae. Green points are photometric data from a variety of instruments. Red line is Spitzer IR data. The Black dashed line is direct radiation from the stellar photosphere. The blue line is the best TORUS computed radiative transfer model inclined at 56°. The orange line is the SED computed from the simple temperature gradient models described in Sect. 4.2.
Current usage metrics show cumulative count of Article Views (full-text article views including HTML views, PDF and ePub downloads, according to the available data) and Abstracts Views on Vision4Press platform.
Data correspond to usage on the plateform after 2015. The current usage metrics is available 48-96 hours after online publication and is updated daily on week days.
Initial download of the metrics may take a while.