Fig. 2
Download original image
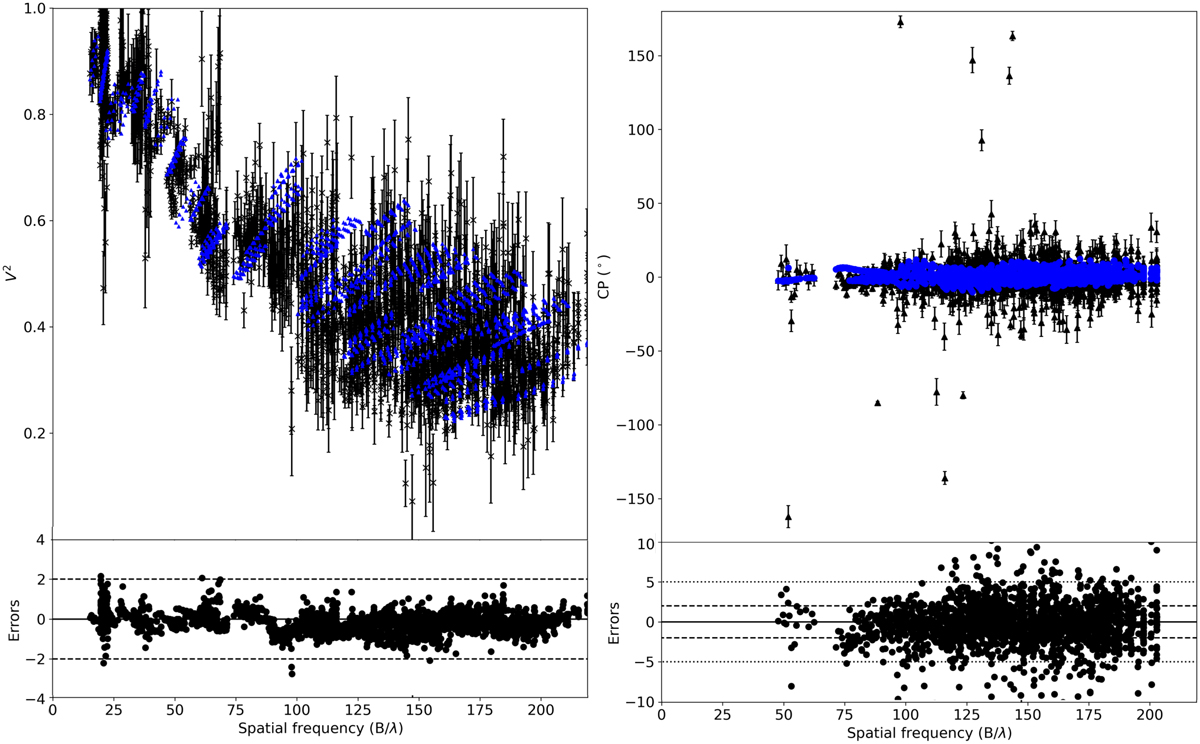
Visibilities and closure phases of the image reconstruction. Black triangles with error bars are the original calibrated observables (squared visibilities on the left and closure phases on the right), over-plotted as blue markers are the model observables of the reconstructed image. Below each plot are the fit residuals normalised by the standard deviation as black circles.
Current usage metrics show cumulative count of Article Views (full-text article views including HTML views, PDF and ePub downloads, according to the available data) and Abstracts Views on Vision4Press platform.
Data correspond to usage on the plateform after 2015. The current usage metrics is available 48-96 hours after online publication and is updated daily on week days.
Initial download of the metrics may take a while.