Open Access
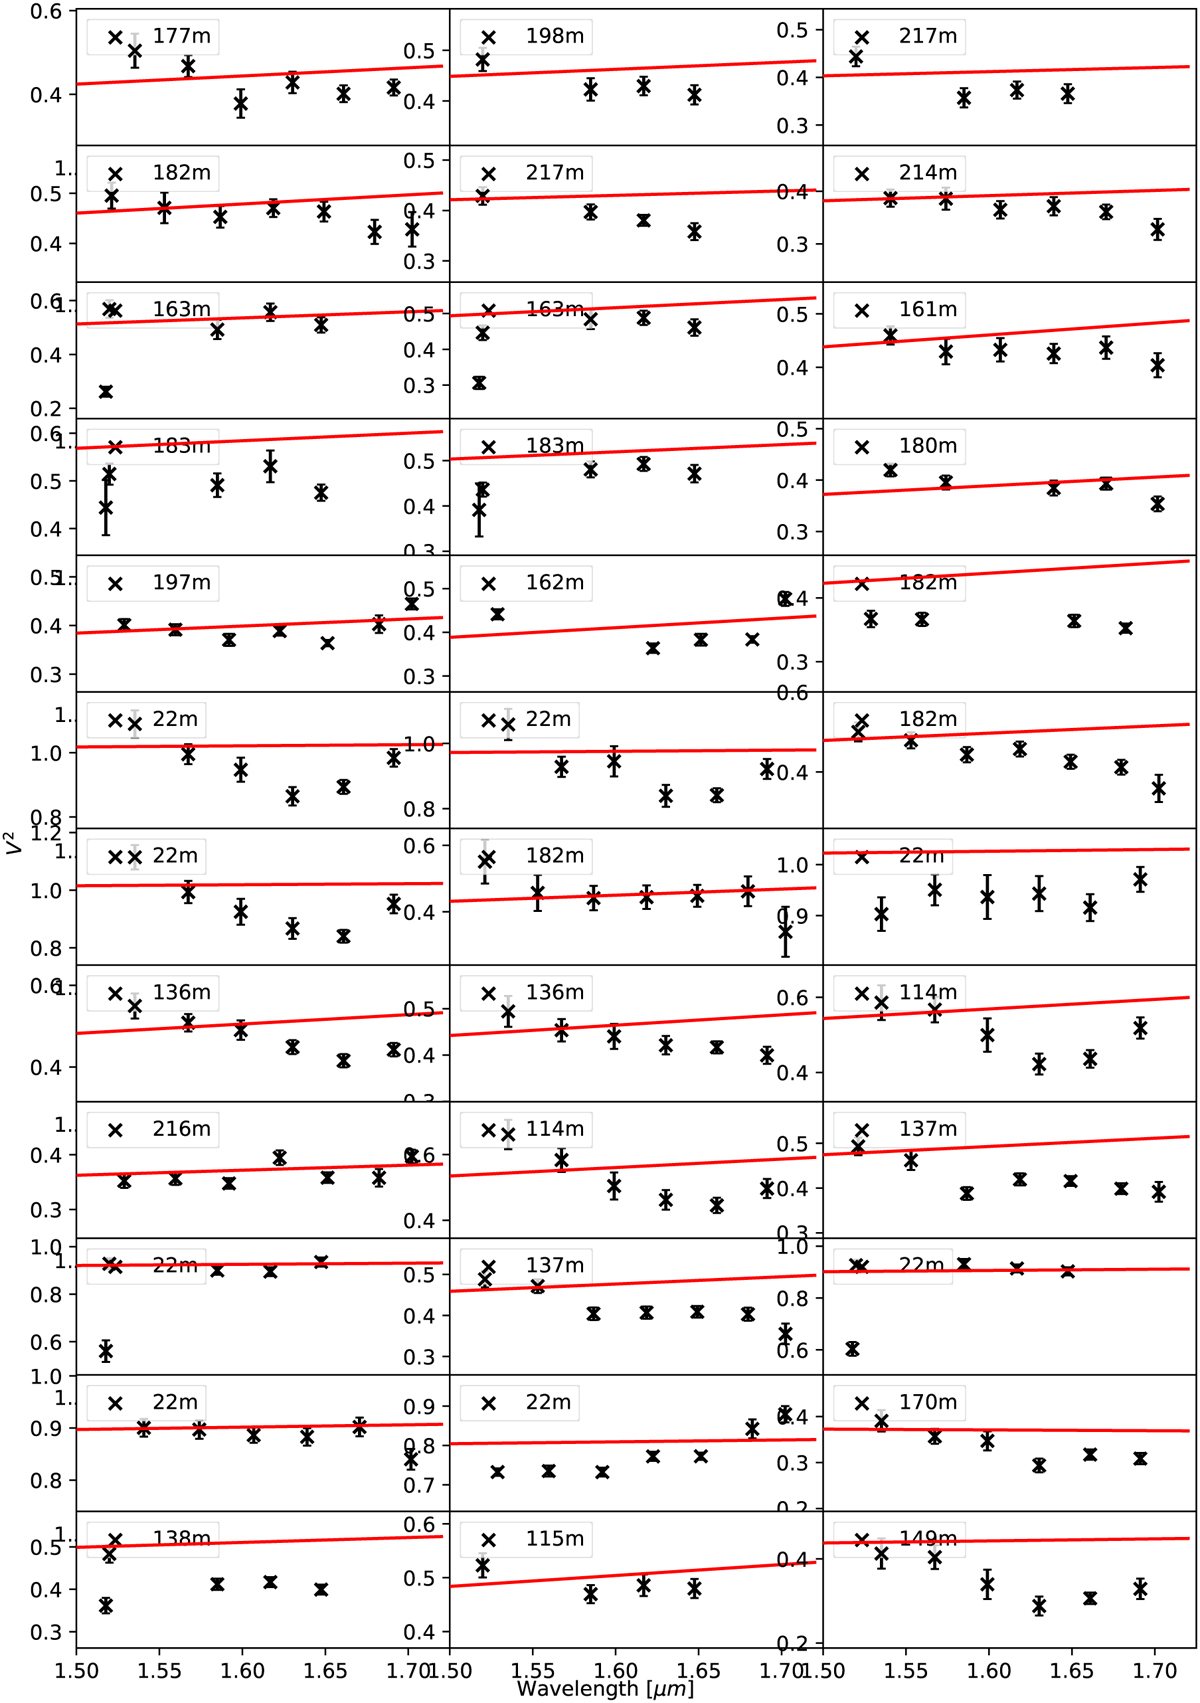
Fig. B.1
Download original image
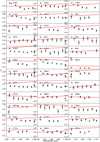
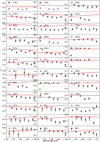
Squared visibilities split by baseline/pointing against wavelength. Black crosses are the measured visibilities. Red lines represent synthetic visibilities from the final TORUS radiate transfer model. The legend of each plot is the length of the individual baseline.
This figure is made of several images, please see below:
Current usage metrics show cumulative count of Article Views (full-text article views including HTML views, PDF and ePub downloads, according to the available data) and Abstracts Views on Vision4Press platform.
Data correspond to usage on the plateform after 2015. The current usage metrics is available 48-96 hours after online publication and is updated daily on week days.
Initial download of the metrics may take a while.