Fig. 2.
Download original image
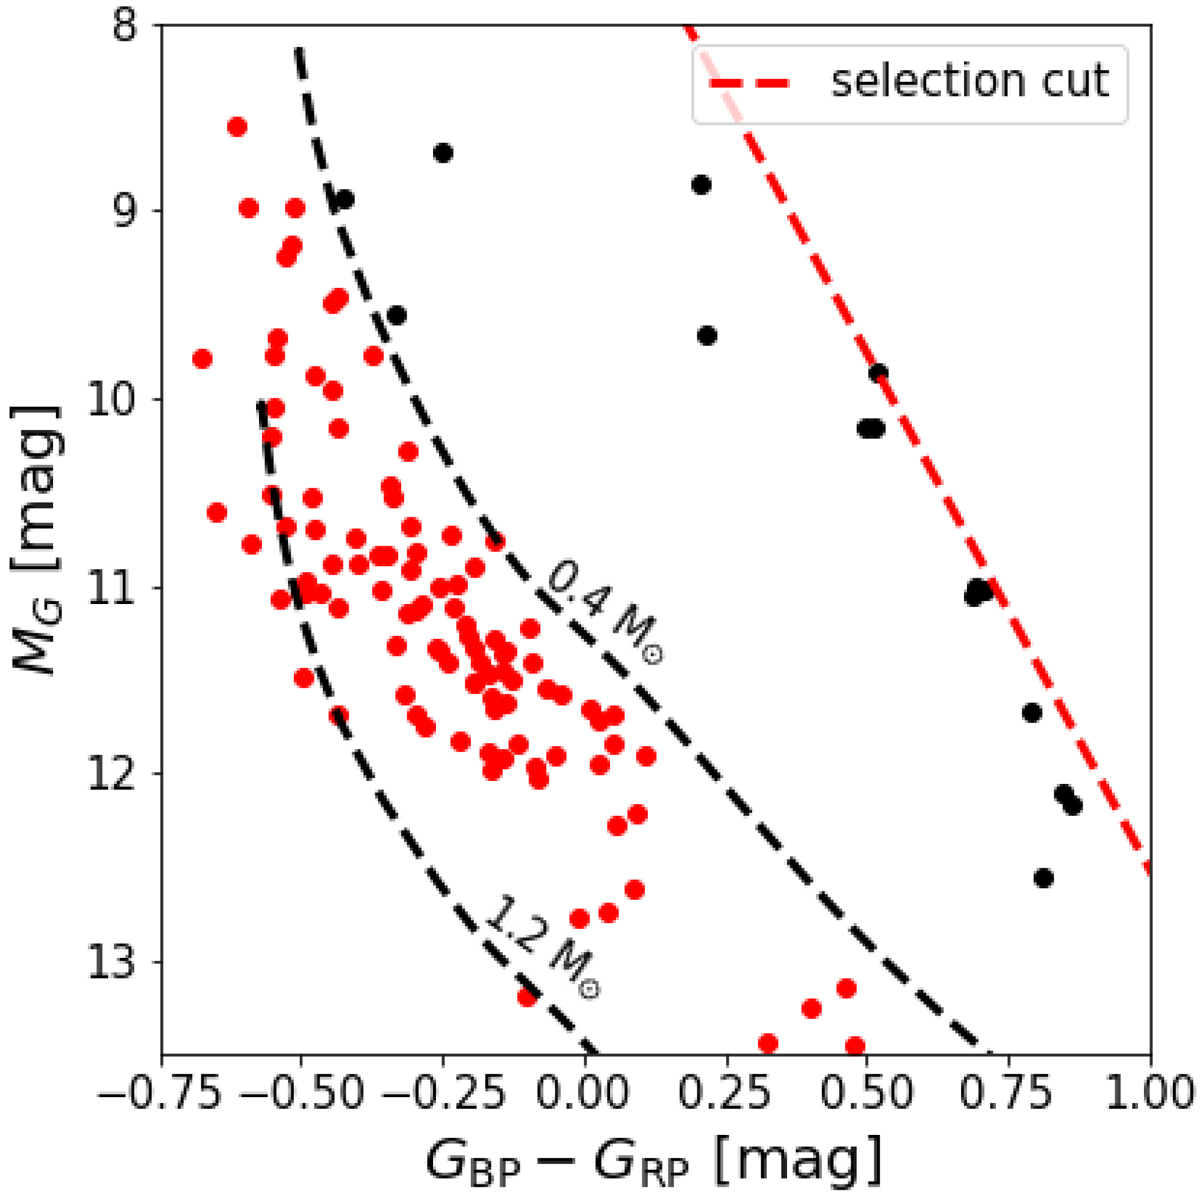
Gaia CMD of WD candidates with probabilities of OC membership from the 5D, 3D, or Hunt & Reffert (2023) analysis ≥0.5. The objects selected for the subsequent analysis are marked in red. The error bars are omitted for clarity. The dashed black lines represent the cooling curves for 0.4 and 1.2 M⊙ DA WDs from Bédard et al. (2020), and the dashed red line indicates the preselection cut employed in Sect. 2. The 4.3 Gyr cooling age isochrone seen in Fig. 1 is outside the bounds of the figure. Discarded objects (in black) lying outside of the region delineated by the 0.4 M⊙ cooling curve and the 4.3 Gyr cooling age isochrone are not considered in the subsequent analysis.
Current usage metrics show cumulative count of Article Views (full-text article views including HTML views, PDF and ePub downloads, according to the available data) and Abstracts Views on Vision4Press platform.
Data correspond to usage on the plateform after 2015. The current usage metrics is available 48-96 hours after online publication and is updated daily on week days.
Initial download of the metrics may take a while.