Fig. 5.

Download original image
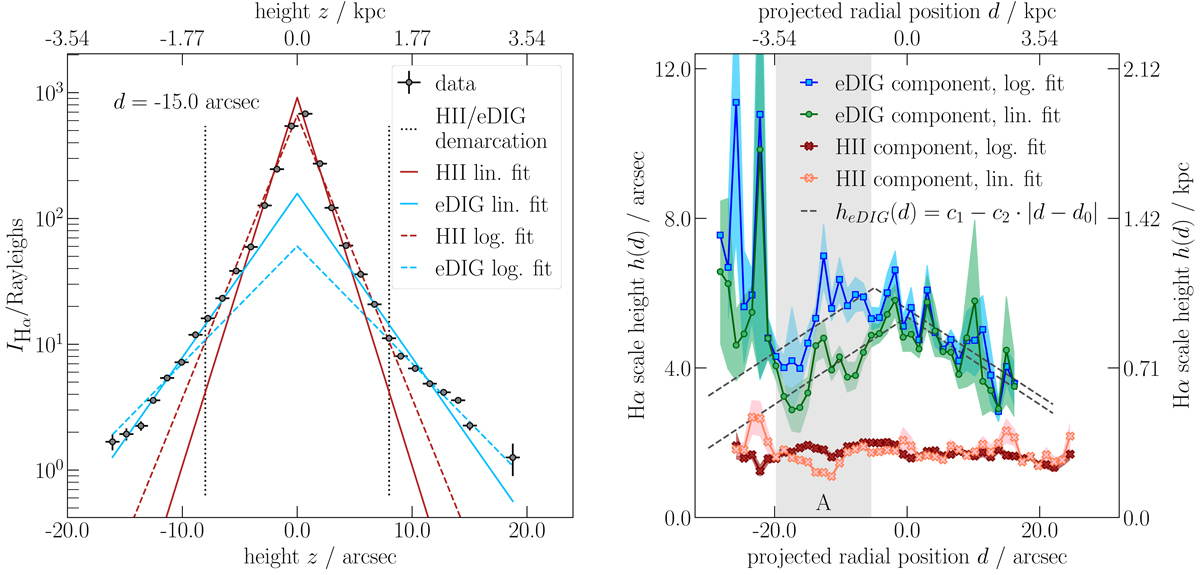
Visualization and results of the Hα scale height fitting. Left: visualization of the IHα fit at the example projected radial distance of d = −15.0″. The dotted lines mark the separation height, zsep = 8″, between bins used for fitting the disk H II (red curves) and eDIG (blue curves) components. The solid curves are derived with linear weighting of IHα according to Eq. (4) and the dashed curves result from logarithmic weighting of IHα during the fit. Right: radial distribution of scale heights for the eDIG (blue squares from logarithmic weighting, green circles from linear weighting) and disk H II (red crosses from logarithmic weighting, orange crosses from linear weighting) components obtained from the fitting. The shaded areas around the scale height curves give the 1σ errors obtained from the corresponding estimated parameter covariance. The dashed lines are best fits of Eq. (5) to the eDIG component scale heights within |d|≤20″. The gray shaded area, A, marks the region where the logarithmic weighting produces significantly larger eDIG scale heights than the linear weighting.
Current usage metrics show cumulative count of Article Views (full-text article views including HTML views, PDF and ePub downloads, according to the available data) and Abstracts Views on Vision4Press platform.
Data correspond to usage on the plateform after 2015. The current usage metrics is available 48-96 hours after online publication and is updated daily on week days.
Initial download of the metrics may take a while.


