Fig. 7.
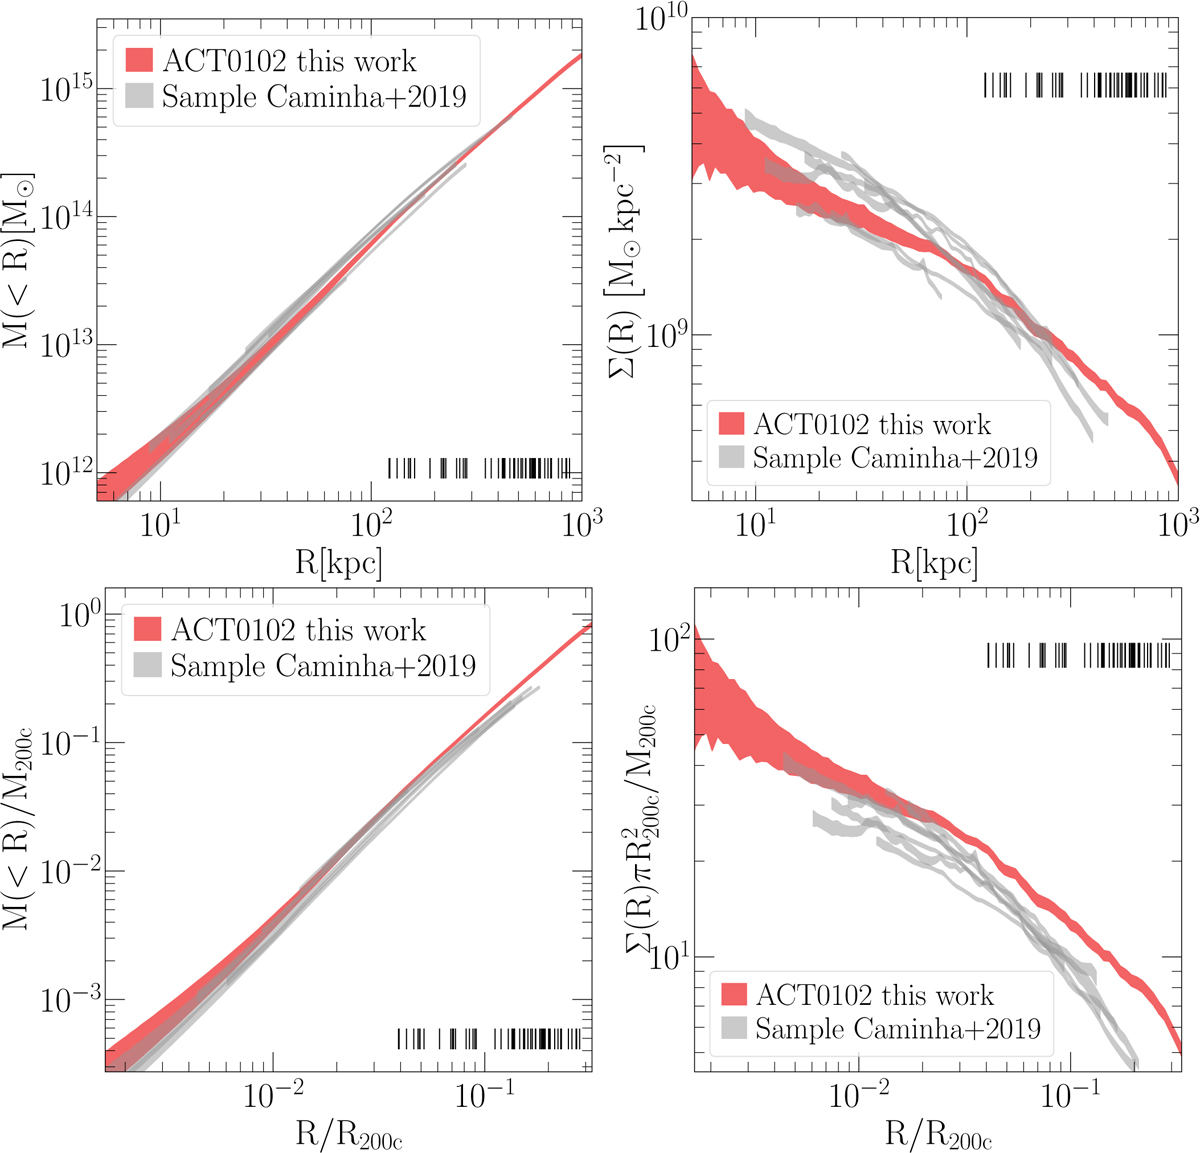
Download original image
Cumulative projected total mass profile (left) and total surface mass density profile (right) computed from the centre of the main cluster component, close to the BCG. The areas in red correspond to the 95% confidence level intervals of our reference lens model for ACT0102. Vertical lines show the radial distances of the multiple images used to reconstruct the cluster total mass distribution. The profiles of other clusters are plotted in grey and are limited to the radial distances over which the multiple images are visible. The top panels show the absolute values, and the bottom panels show the values rescaled to those of M200c and R200c (see the axis labels).
Current usage metrics show cumulative count of Article Views (full-text article views including HTML views, PDF and ePub downloads, according to the available data) and Abstracts Views on Vision4Press platform.
Data correspond to usage on the plateform after 2015. The current usage metrics is available 48-96 hours after online publication and is updated daily on week days.
Initial download of the metrics may take a while.