Open Access
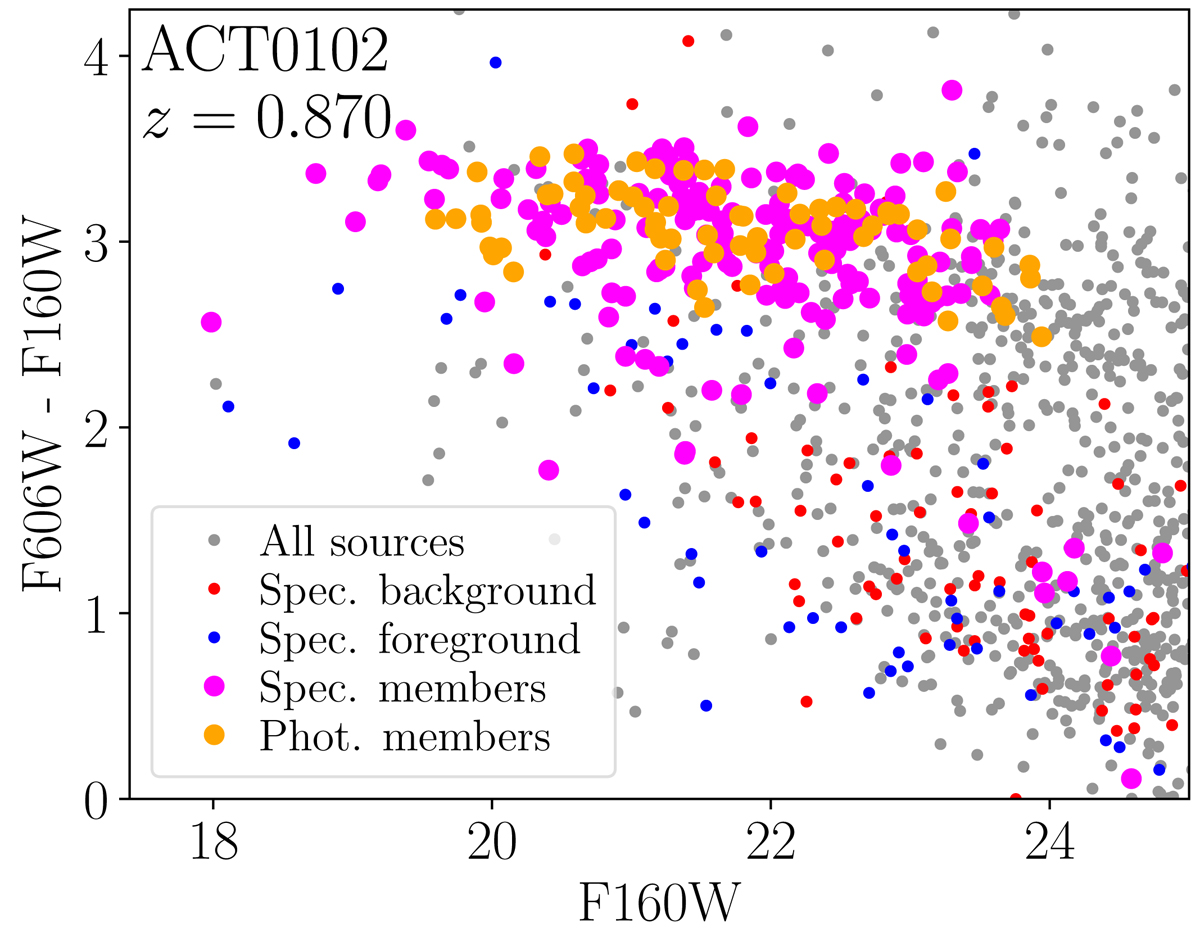
Fig. 6.
Download original image
Colour magnitude diagram of ACT0102. Spectroscopic members are shown in magenta and photometrically selected ones in orange (see Sect. 3 for more details on our selection criteria). Spectroscopically confirmed background and foreground objects are indicated by red and blue dots, respectively.
Current usage metrics show cumulative count of Article Views (full-text article views including HTML views, PDF and ePub downloads, according to the available data) and Abstracts Views on Vision4Press platform.
Data correspond to usage on the plateform after 2015. The current usage metrics is available 48-96 hours after online publication and is updated daily on week days.
Initial download of the metrics may take a while.