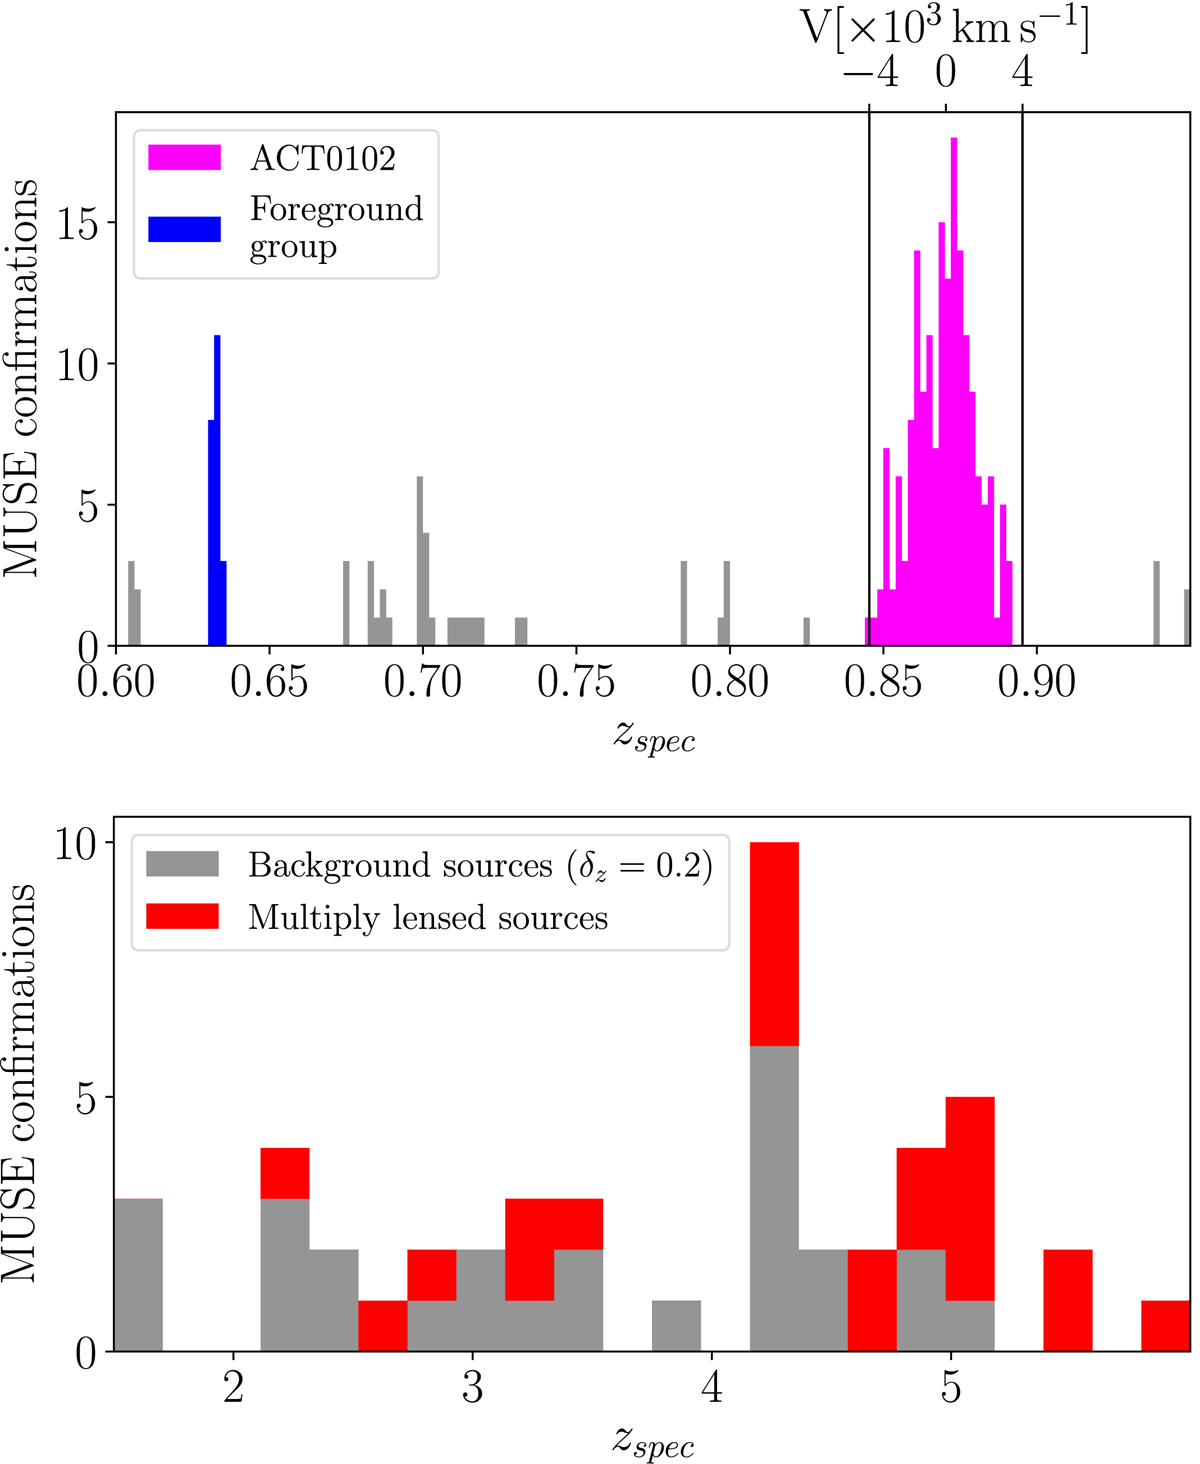
Fig. 5.
Download original image
Spectroscopic confirmations with MUSE. Top panel: redshift distribution of the objects in the MUSE catalogue in bins of δz = 0.002. The magenta and blue histograms indicate, respectively, the ACT0102 cluster members (167 galaxies) and the foreground group (20 galaxies) used in our strong lensing modelling. The upper x-axis shows the line-of-sight rest-frame galaxy velocity with respect to the cluster member median redshift value of z = 0.8704. Bottom panel: redshift distribution of background single sources (i.e., corrected by image multiplicity) with δz = 0.2, where the overdensity at z ≈ 4.2 is clearly noted.
Current usage metrics show cumulative count of Article Views (full-text article views including HTML views, PDF and ePub downloads, according to the available data) and Abstracts Views on Vision4Press platform.
Data correspond to usage on the plateform after 2015. The current usage metrics is available 48-96 hours after online publication and is updated daily on week days.
Initial download of the metrics may take a while.