Open Access
Fig. A.1.
Download original image
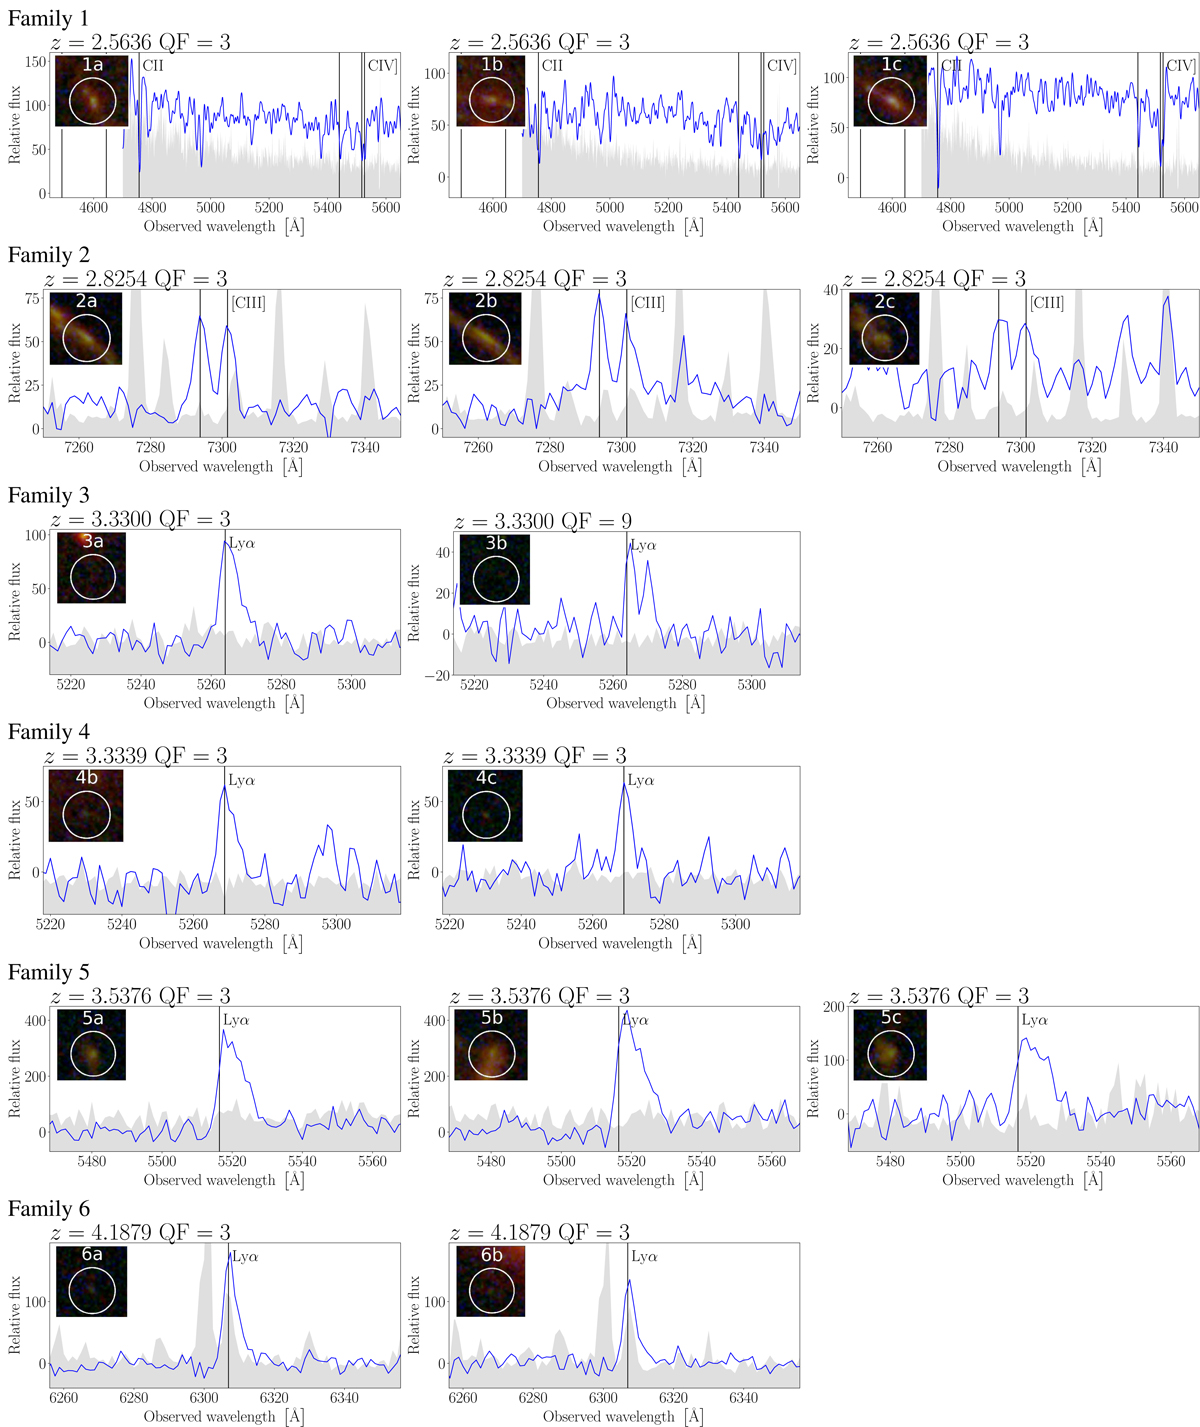
Multiple image spectra of all the confirmed multiple images. Vertical lines indicate spectral features at the source redshift, and the grey curves the scaled data variance. The cut-out images are composed with the same HST filters as in Fig. 1, and the circles have 1″ diameters.
Current usage metrics show cumulative count of Article Views (full-text article views including HTML views, PDF and ePub downloads, according to the available data) and Abstracts Views on Vision4Press platform.
Data correspond to usage on the plateform after 2015. The current usage metrics is available 48-96 hours after online publication and is updated daily on week days.
Initial download of the metrics may take a while.