Fig. 1.
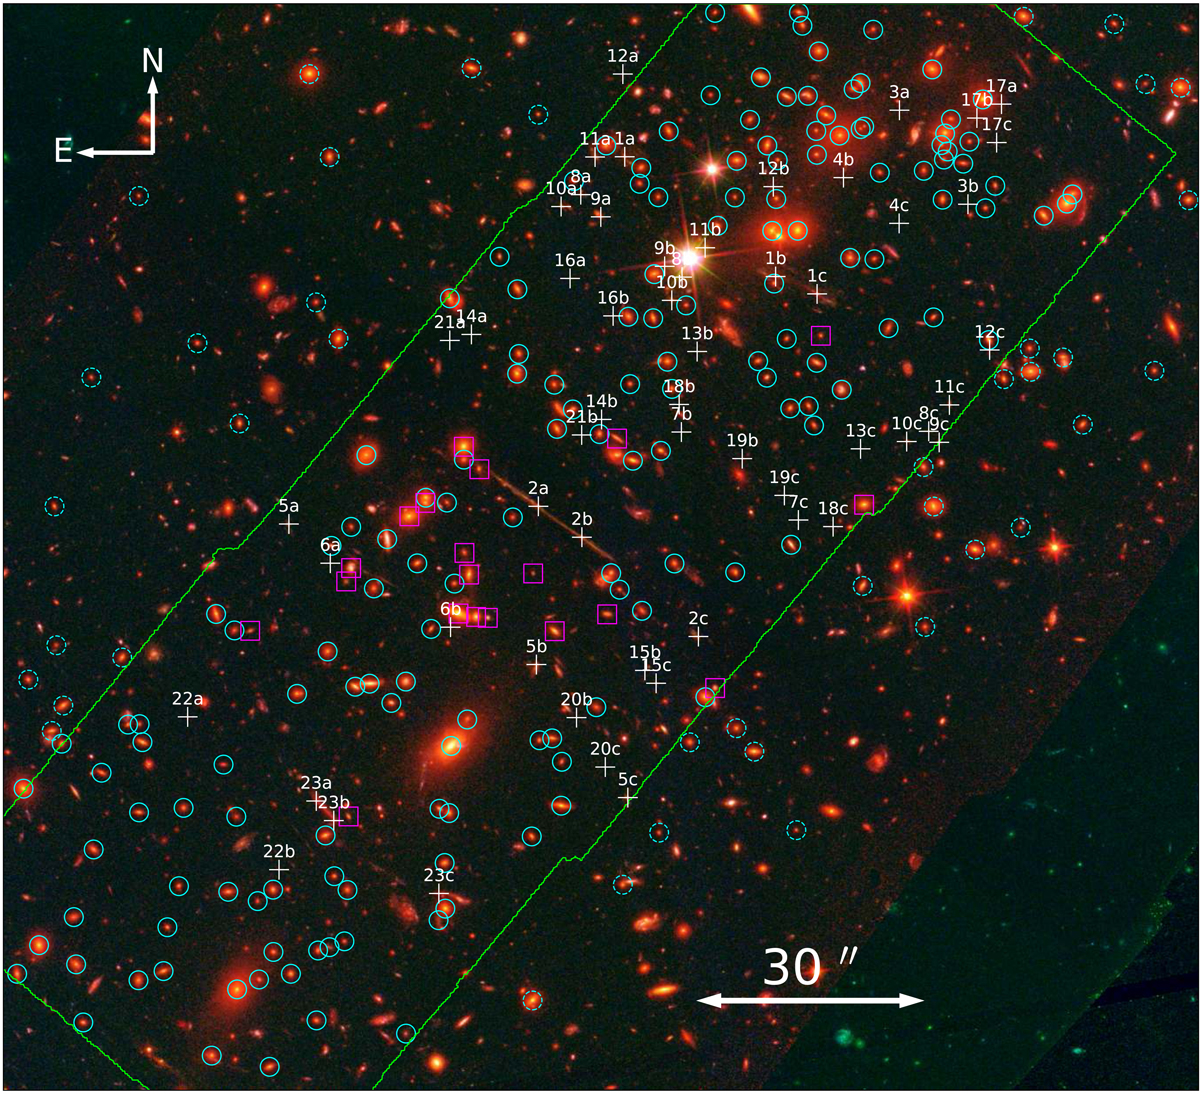
Download original image
ACT0102 MUSE field of view overlaid on a HST colour image (where the filter F435W is blue; F606W+F625W+F775W+F850LP is green; and F105W+F125W+F140W+F160W is red). Green lines show the MUSE mosaic footprint, which is composed of three pointings with an exposure time of ≈2.3 h. Cyan (dashed) circles indicate spectroscopically (photometrically) selected cluster members (see Fig. 6). Galaxies marked with magenta boxes belong to the group at z = 0.63 (see Fig. 5). The multiple images used in our strong lensing model are shown by white crosses, and all the multiple image families have secure spectroscopic redshift measurements.
Current usage metrics show cumulative count of Article Views (full-text article views including HTML views, PDF and ePub downloads, according to the available data) and Abstracts Views on Vision4Press platform.
Data correspond to usage on the plateform after 2015. The current usage metrics is available 48-96 hours after online publication and is updated daily on week days.
Initial download of the metrics may take a while.