Fig. 8
Download original image
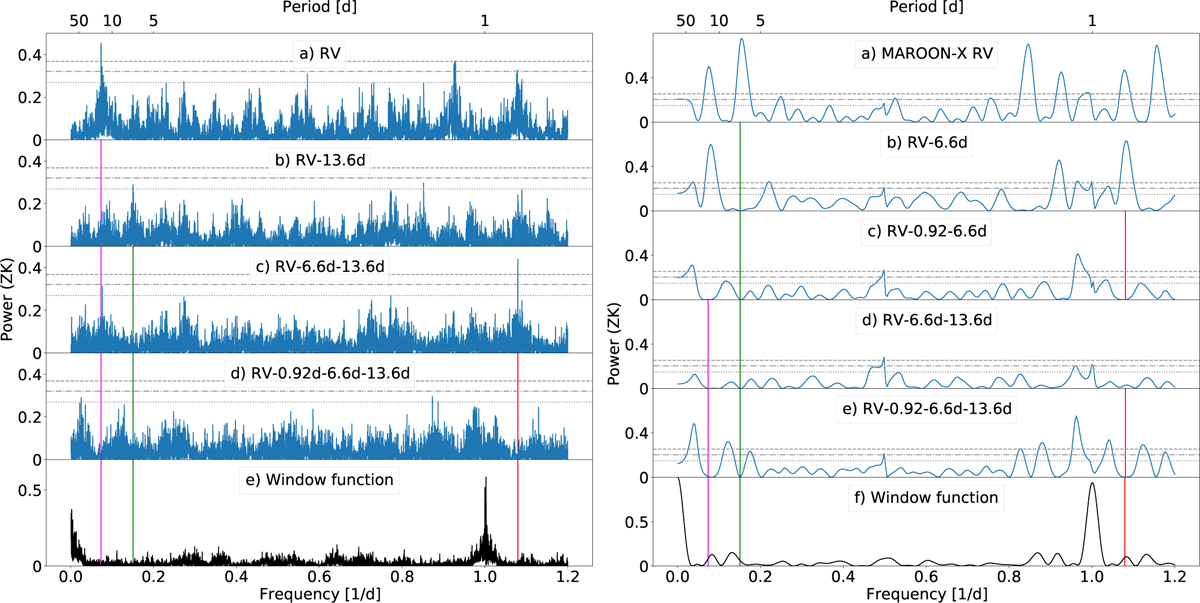
Generalized Lomb-Scargle (GLS) periodograms of CARMENES (left) and MAROON-X (right) RV measurements and the residual RVs after subtraction of different models. In all panels, the 10%, 1%, and 0.1% FAP levels are indicated by grey dotted, dash-dotted, and dashed lines, respectively. Left panels: a) GLS of RV dataset. b) GLS of the RV residuals after fitting the 13.6 d signal (vertical magenta line). c) GLS of the RV residuals after simultaneously fitting the 6.6 d (vertical green line) and 13.6 d signals. d) GLS of the RV residuals after simultaneously fitting the transitting planet (P = 0.926 d, vertical red line), 6.6 d, and 13.6 d signals. Right panels: a) GLS of RV dataset. b) GLS of the RV residuals after fitting the 6.6 d signal (vertical green line). c) GLS of the RV residuals after simultaneously fitting the transiting planet (P = 0.926 d, vertical red line) and 6.6 d signals. d) GLS of the RV residuals after simultaneously fitting the 6.6 d and 13.6 d (vertical magenta line) signals. e) GLS of the RV residuals after simultaneously fitting the transiting planet, 6.6 d, and 13.6 d signals. f) Window function.
Current usage metrics show cumulative count of Article Views (full-text article views including HTML views, PDF and ePub downloads, according to the available data) and Abstracts Views on Vision4Press platform.
Data correspond to usage on the plateform after 2015. The current usage metrics is available 48-96 hours after online publication and is updated daily on week days.
Initial download of the metrics may take a while.