Fig. 7
Download original image
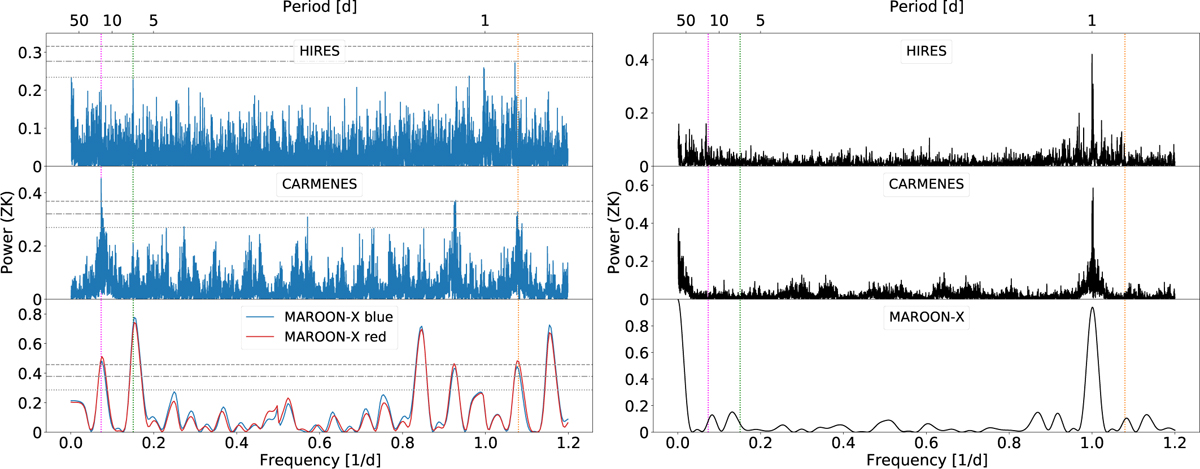
Radial velocity analysis of CARMENES, HIRES, and MAROON-X data. Left: generalized Lomb-Scargle (GLS) periodograms of the HIRES (top), CARMENES (middle), and the two MAROON-X channels (bottom) radial velocity time series. The vertical dotted lines indicate the highest peaks at 13.6 d (magenta), 6.6 d (green), and 0.92 d (orange). The 10%, 1%, and 0.1% FAP levels are indicated by grey dotted, dash-dotted, and dashed lines, respectively. Right: window functions of the HIRES, CARMENES, and MAROON-X channels time series. The vertical dotted lines indicate the 13.6 d (magenta), 6.6 d (green), and 0.92d (orange) periods.
Current usage metrics show cumulative count of Article Views (full-text article views including HTML views, PDF and ePub downloads, according to the available data) and Abstracts Views on Vision4Press platform.
Data correspond to usage on the plateform after 2015. The current usage metrics is available 48-96 hours after online publication and is updated daily on week days.
Initial download of the metrics may take a while.