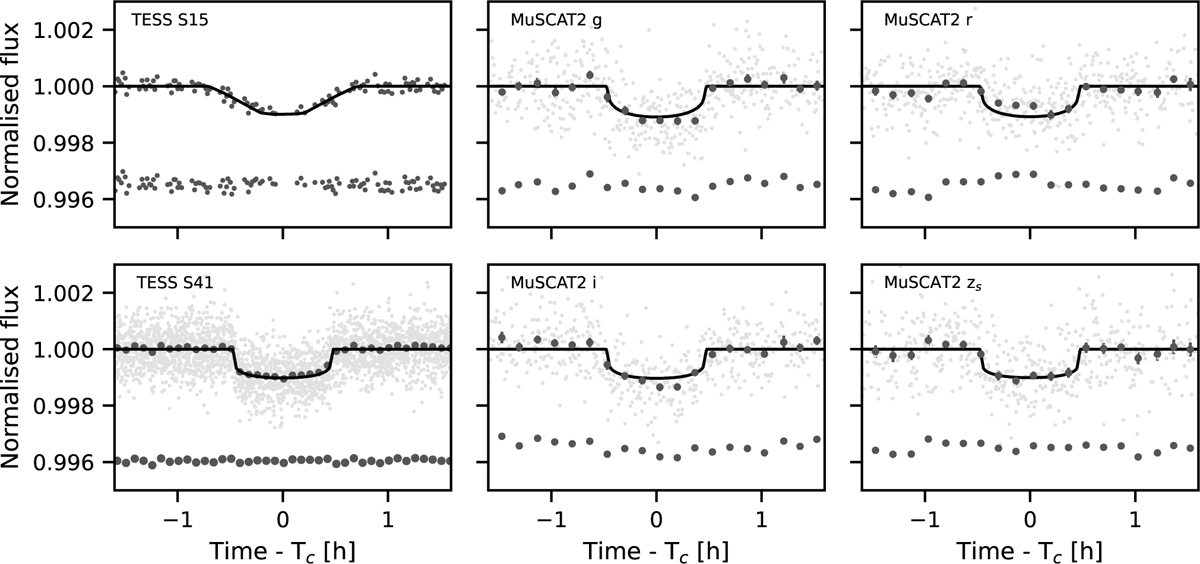
Fig. 6
Download original image
Phase-folded TESS and MuSCAT2 photometry with the median posterior model. The small dots show the original data and the larger dots show data binned to 5 min (TESS) and 10 min (M2) resolution for visualization. The black line shows the posterior median transit model for each passband and dataset. The model for 30 min cadence TESS QLP light curve is supersampled with ten samples per exposure.
Current usage metrics show cumulative count of Article Views (full-text article views including HTML views, PDF and ePub downloads, according to the available data) and Abstracts Views on Vision4Press platform.
Data correspond to usage on the plateform after 2015. The current usage metrics is available 48-96 hours after online publication and is updated daily on week days.
Initial download of the metrics may take a while.