Fig. B.2
Download original image
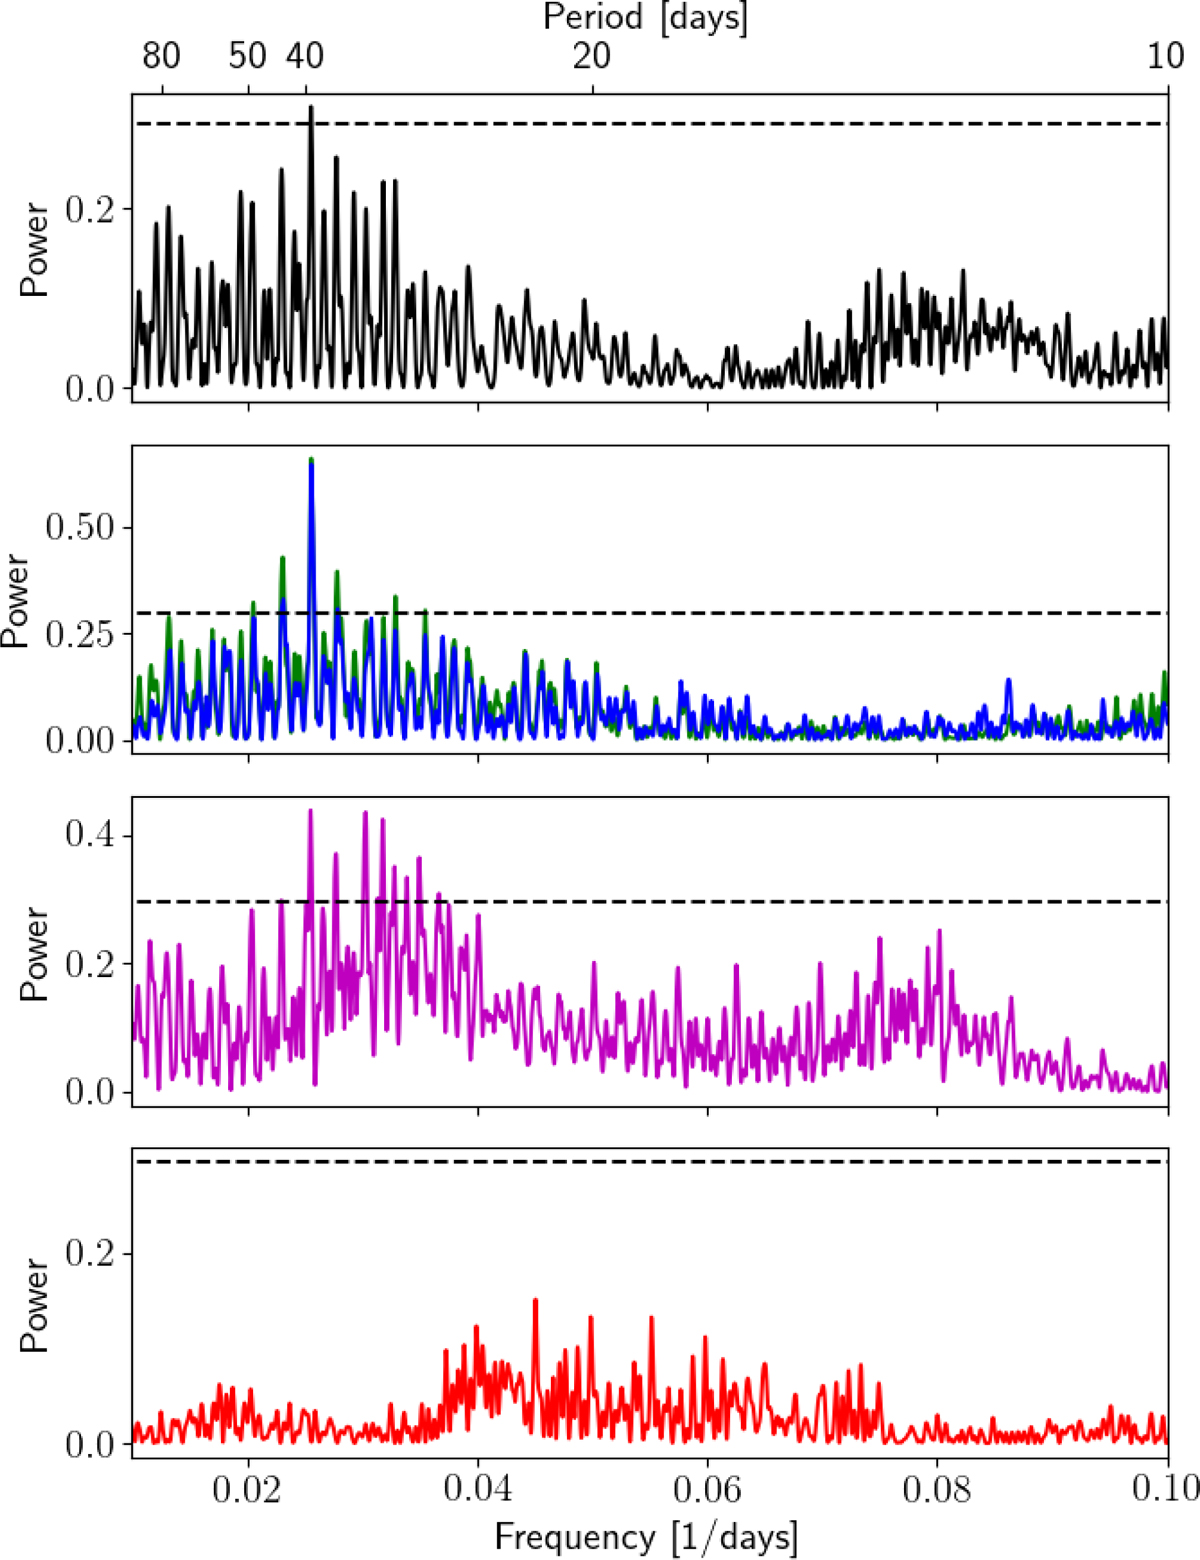
GLS periodogram of GJ 806 for different detrended time series. The black line (top panel) denotes the GLS of pEW(Hα); the blue and the green line (second panel from top) denote respectively the bluest and the middle line of the Ca II IRT; the violet line (third panel from top) denotes the TiO index; and the red line (bottom panel) denotes the window function. In all panels, the dashed horizontal line marks the FAP of 0.01, above which signals are rated as significant.
Current usage metrics show cumulative count of Article Views (full-text article views including HTML views, PDF and ePub downloads, according to the available data) and Abstracts Views on Vision4Press platform.
Data correspond to usage on the plateform after 2015. The current usage metrics is available 48-96 hours after online publication and is updated daily on week days.
Initial download of the metrics may take a while.