Fig. 14
Download original image
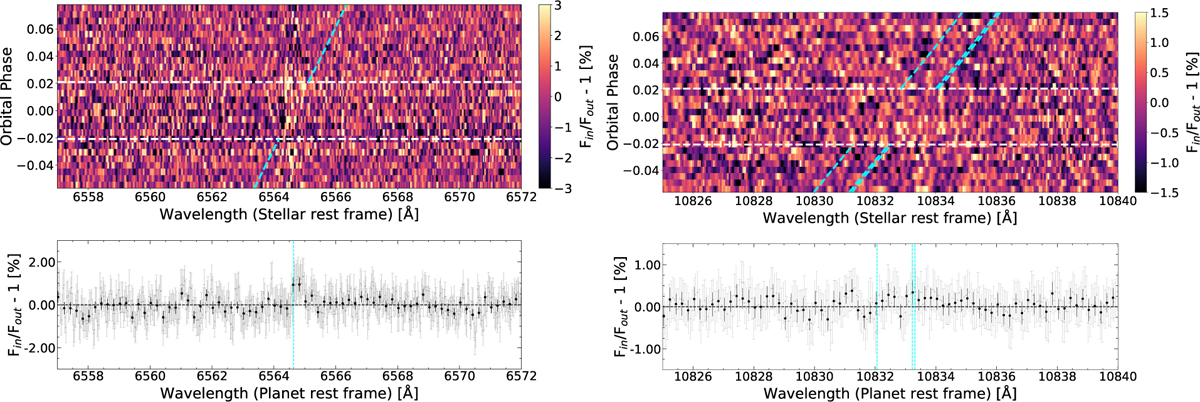
Residuals maps and transmission spectra around the Hα line (left) and He I triplet lines (right). Top panels: residual maps in the stellar rest frame. The planet orbital phase is shown on the vertical axis, the wavelength is on the horizontal axis, and the relative absorption is colour-coded. The dashed white horizontal lines indicate the first and fourth contacts. The cyan lines show the theoretical trace of the planetary signals. Bottom panels: transmission spectra obtained combining all the spectra between the first and fourth contacts. All the wavelengths in this figure are referenced in a vacuum.
Current usage metrics show cumulative count of Article Views (full-text article views including HTML views, PDF and ePub downloads, according to the available data) and Abstracts Views on Vision4Press platform.
Data correspond to usage on the plateform after 2015. The current usage metrics is available 48-96 hours after online publication and is updated daily on week days.
Initial download of the metrics may take a while.