Fig. 13
Download original image
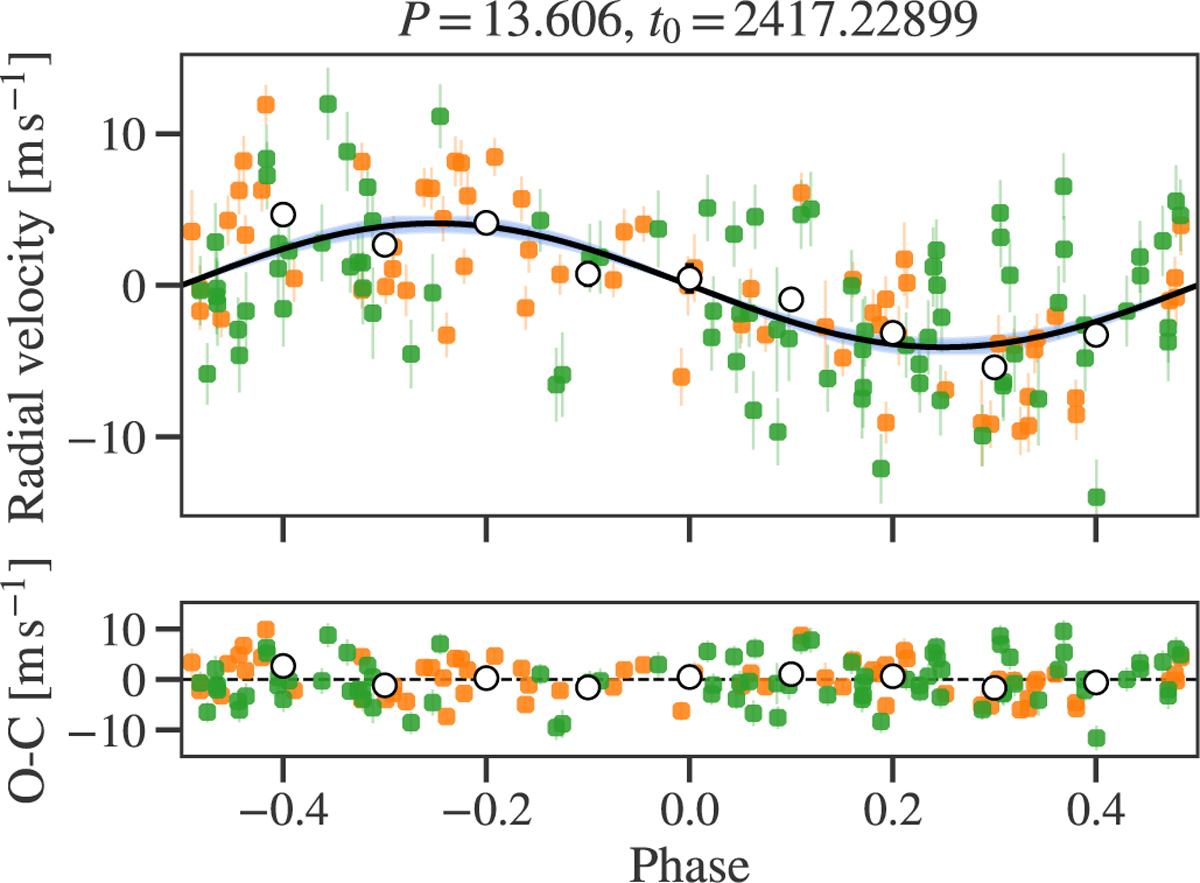
Radial velocities phase-folded to the period and central time of transit (shown above each panel, period units are days and central time of transit t0 units are BJD − 2 457 000) for the 13.6 d signal along with the best-fit model (black line) and 3σ confidence intervals (shaded light blue areas). RVs from CARMENES (orange) and HIRES (green) and binned RVs (white dots with black error bars) are also shown. The instrument error bars include the extra jitter term added in quadrature.
Current usage metrics show cumulative count of Article Views (full-text article views including HTML views, PDF and ePub downloads, according to the available data) and Abstracts Views on Vision4Press platform.
Data correspond to usage on the plateform after 2015. The current usage metrics is available 48-96 hours after online publication and is updated daily on week days.
Initial download of the metrics may take a while.