Fig. 2.
Download original image
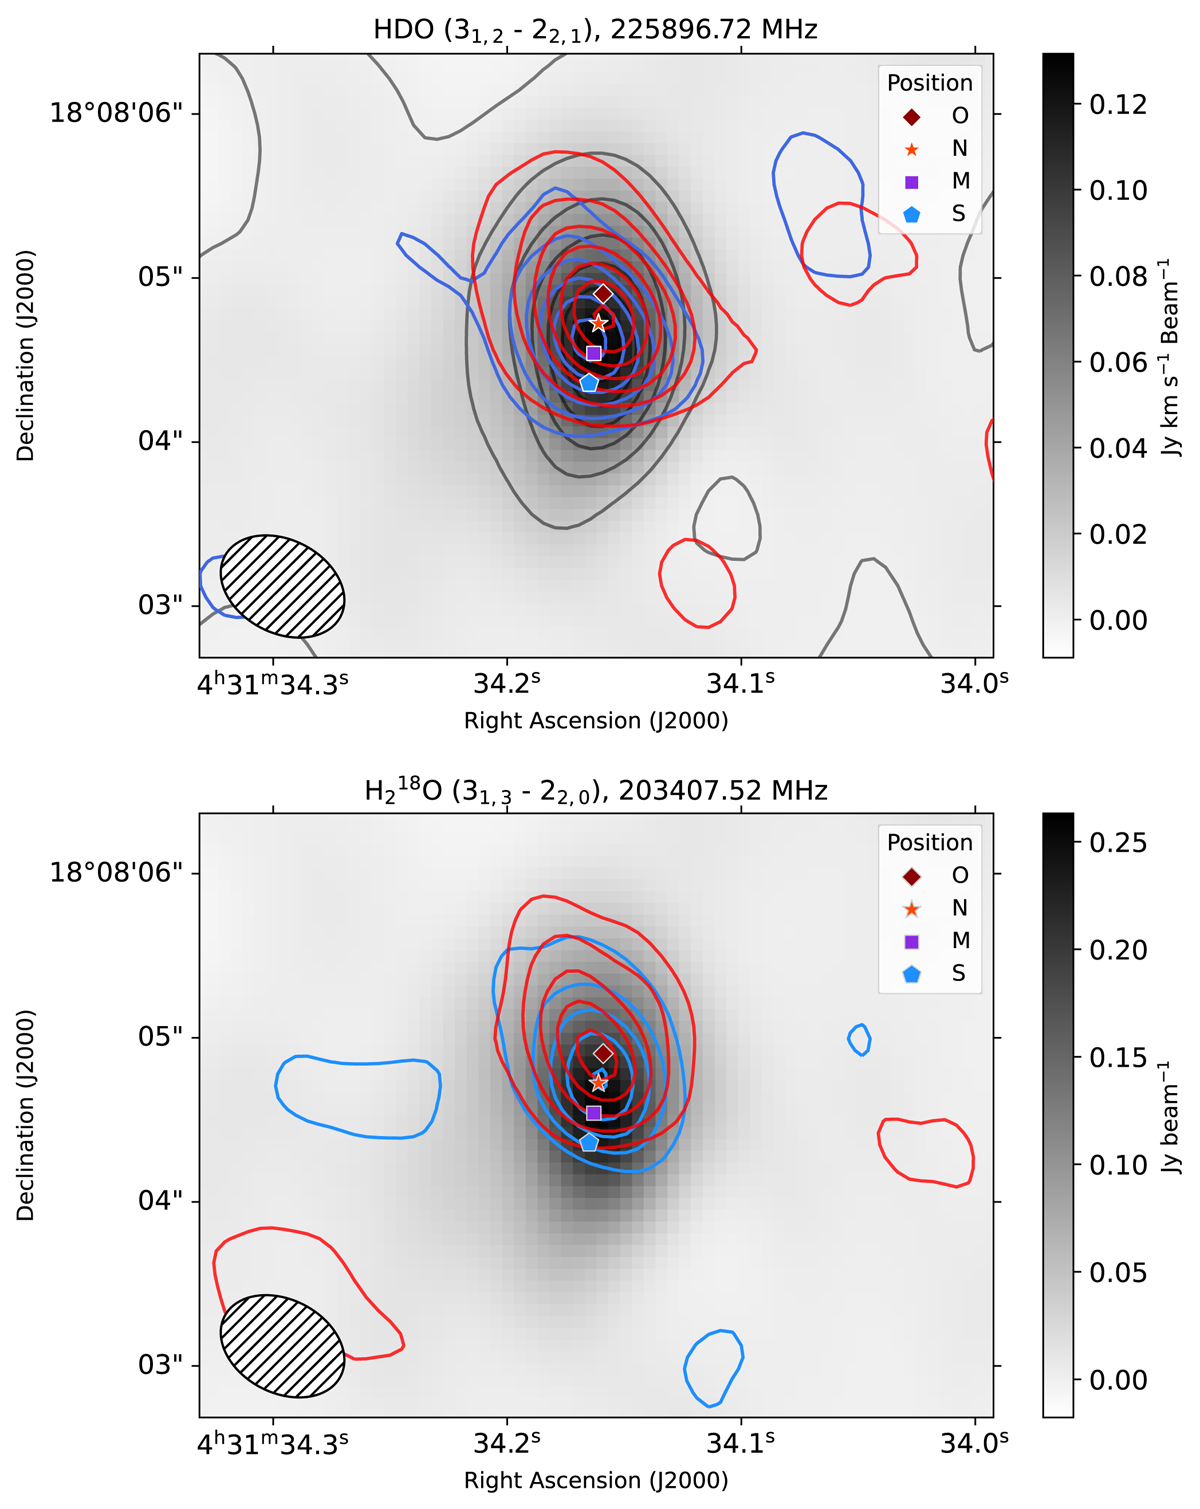
Integrated emission maps of the HDO line at 225.9 GHz (top) and the ![]() line at 203.4 GHz (bottom). The blue and red contours correspond to the integrated flux between 4.5 and 7.5 km s−1 and 7.5 and 12 km s−1, respectively. The levels of contours start at 3σ with a step of 3σ for all except for the HDO contours in red (7.5–12 km s−1) which are spaced by 5σ. Dust continuum is indicated in grayscale. The beam sizes are shown in the bottom left corner.
line at 203.4 GHz (bottom). The blue and red contours correspond to the integrated flux between 4.5 and 7.5 km s−1 and 7.5 and 12 km s−1, respectively. The levels of contours start at 3σ with a step of 3σ for all except for the HDO contours in red (7.5–12 km s−1) which are spaced by 5σ. Dust continuum is indicated in grayscale. The beam sizes are shown in the bottom left corner.
Current usage metrics show cumulative count of Article Views (full-text article views including HTML views, PDF and ePub downloads, according to the available data) and Abstracts Views on Vision4Press platform.
Data correspond to usage on the plateform after 2015. The current usage metrics is available 48-96 hours after online publication and is updated daily on week days.
Initial download of the metrics may take a while.