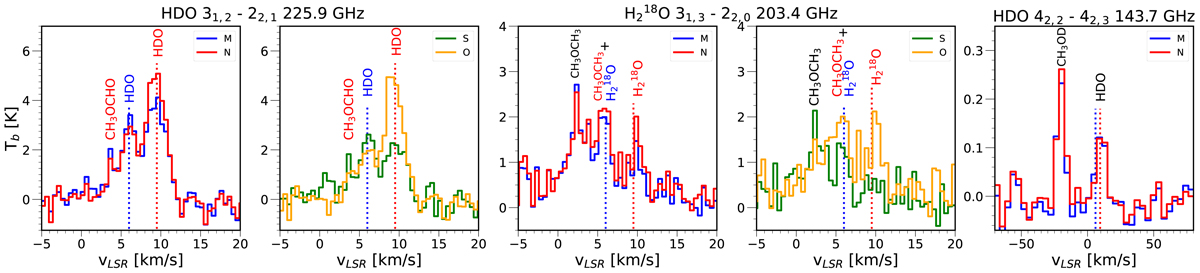
Fig. 1.
Download original image
Comparison of the spectra of the water isotopolog transitions. The green, blue, red, and orange solid lines represent the spectra extracted at the position S, M, N, and O, respectively. The dotted lines show velocities of 6.0 km s−1 (blue) and 9.5 km s−1 (red). Considering the synthetic beam sizes and the separation of the N and S components, the extracted spectra are not entirely independent from each other. For the HDO line at 143.7 GHz, the spatial resolution is too low to distinguish O from N and M from S. The x-axis scale is larger for this transition.
Current usage metrics show cumulative count of Article Views (full-text article views including HTML views, PDF and ePub downloads, according to the available data) and Abstracts Views on Vision4Press platform.
Data correspond to usage on the plateform after 2015. The current usage metrics is available 48-96 hours after online publication and is updated daily on week days.
Initial download of the metrics may take a while.