Fig. 3.
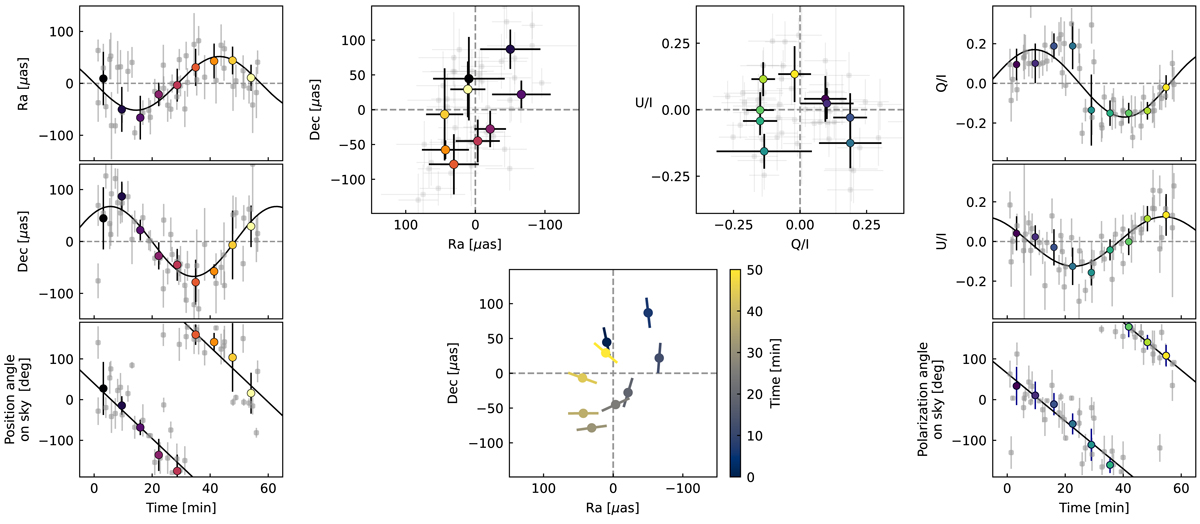
Download original image
Combined astrometric (left) and polarimetric (right) data. The outer left panels show RA, Dec, and position angle on the sky as a function of time. The outer right panels show Q/I, U/I, and polarization angle on the sky vs. time. The full data are shown in gray, the colored points are bins of five minutes, and the color indicates time. The binned data are obtained after wrapping all points around the fit period of 60 min, and the error bars are the standard deviation of the binned data. Overplotted on the angle plots are slopes of 6 ° /min = 360 ° /h. The top middle panels illustrate the loops on the sky (left) and in the Q − U plane (right). The bottom middle panel shows the rotation of the polarization for the corresponding astrometric points, one polarization rotation per astrometric orbit. The electric field vector rotates clockwise in the plane of the sky, and in the Q − U plane.
Current usage metrics show cumulative count of Article Views (full-text article views including HTML views, PDF and ePub downloads, according to the available data) and Abstracts Views on Vision4Press platform.
Data correspond to usage on the plateform after 2015. The current usage metrics is available 48-96 hours after online publication and is updated daily on week days.
Initial download of the metrics may take a while.